嗨嗨嗨第四期来啦:
1: 将小数转化为分数并提取分子和分母a=2065/2013 ;
b=split(rats(a),'/')
c=str2num(b{1})
d=str2num(b{2})
b = 2×1 cell 数组 {’ 2065’} {'2013 ’ } \, c = 2065 \, d = 2013
2:元胞与数组转化 2.1:元胞转数值数组将全部元素提取出来并排列成一列:
A={1,2,3;4,5,6;7,8,9}
% 将全部元素提取出来并排列成一列
B1=[A{:}]'
A = 3×3 cell 数组 {[1]} {[2]} {[3]} {[4]} {[5]} {[6]} {[7]} {[8]} {[9]} \, B1 = 1 4 7 2 5 8 3 6 9
将数值元胞数组转换为数值数组:
A={1,2,3;4,5,6;7,8,9};
% 将数值元胞数组转换为数值数组
B2=cell2mat(A)
% 以下方式也可但速度较慢
% B2=reshape([A{:}],size(A))
B2 = 1 2 3 4 5 6 7 8 9
字符串元胞转数值数组:
C={'12','34';'56','78'}
D=reshape(str2num(char(C)),size(C))
C = 2×2 cell 数组 {‘12’} {‘34’} {‘56’} {‘78’} \, D = 12 34 56 78
2.2:数值数组转元胞分块并转元胞
A=[1,2,3;4,5,6]
% 行分成两块每块一行
% 列分成两块分别1行和2行
B=mat2cell(A,[1,1],[1,2])
A = 1 2 3 4 5 6 \, B = 2×2 cell 数组 {[1]} {[2 3]} {[4]} {[5 6]}
不分块转元胞,以下两种方法等价,但显然第二种方法简单很多:
A=[1,2,3;4,5,6];

B1=mat2cell(A,ones(1,size(A,1)),ones(1,size(A,2)))

B2=num2cell(A)
B1 = 2×3 cell 数组 {[1]} {[2]} {[3]} {[4]} {[5]} {[6]} \, B2 = 2×3 cell 数组 {[1]} {[2]} {[3]} {[4]} {[5]} {[6]}
3:属性元胞对于这样要重复设置很多次的属性:
x=0:.2:4*pi;

hold on
plot(x,sin(x),'-s','LineWidth',2,'MarkerSize',10);
plot(x,sin(0.5.*x),'-^','LineWidth',2,'MarkerSize',10);
plot(x,sin(x).^2,'-o','LineWidth',2,'MarkerSize',10);
不妨将其存到元胞数组中:
x=0:.2:4*pi;

hold on
tc={'LineWidth',2,'MarkerSize',10};

plot(x,sin(x),'-s',tc{:});
plot(x,sin(0.5.*x),'-^',tc{:});
plot(x,sin(x).^2,'-o',tc{:});

一维向量:
oriData=[1 nan nan 4 nan 5 6]
oriData(isnan(oriData))=[]
oriData = 1 NaN NaN 4 NaN 5 6 \, oriData = 1 4 5 6
删除含nan的行:
oriData=[1 2;nan 4;5 6;7 nan]
tData=sum(oriData,2);
oriData(isnan(tData),:)=[]
oriData = \,\,\,\,\,\, 1 \,\,\,\,\,\, 2 NaN \,\,\,\,\,\, 4 \,\,\,\,\,\, 5 \,\,\,\,\,\, 6 \,\,\,\,\,\, 7 NaN \, oriData = 1 2 5 6
当然如果要删除含nan的列,将代码改为:
tData=sum(oriData,1);
oriData(:,isnan(tData))=[]
当然举一反三一下,用isinf函数可以删除无穷值。
众所周知whos函数可以获取当前工作区变量:
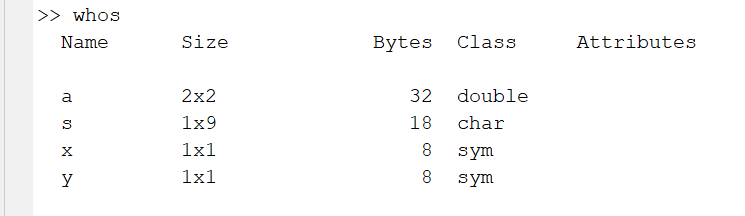
而在函数中或在app中,whos函数获取的是当前域内的变量而不是工作区变量。可以使用evalin函数获取指定为base工作区的变量:
evalin('base','whos')
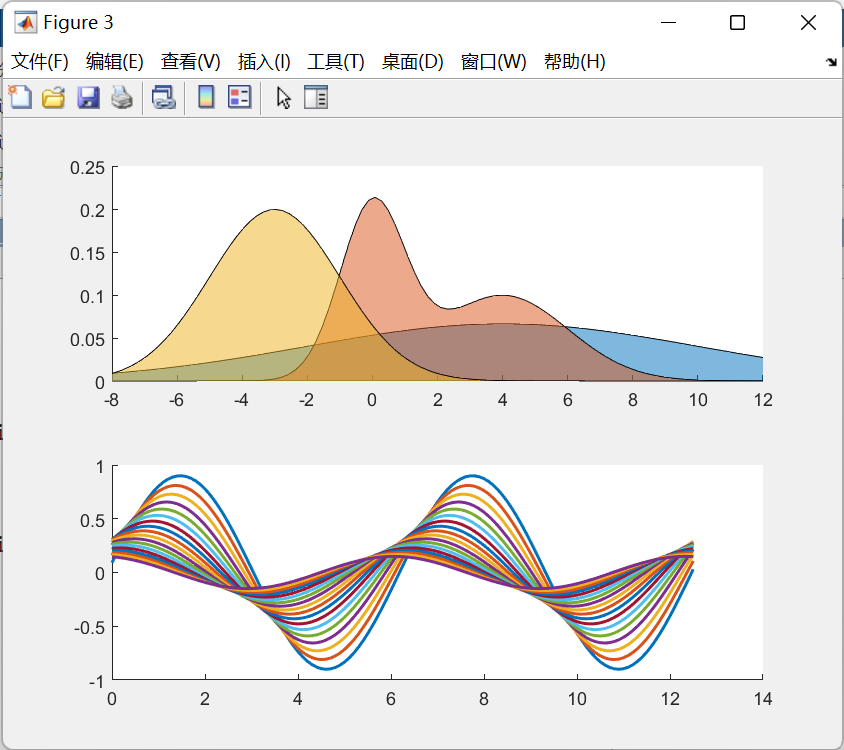
假如我们有两个fig文件,分别名为1.fig,2.fig: 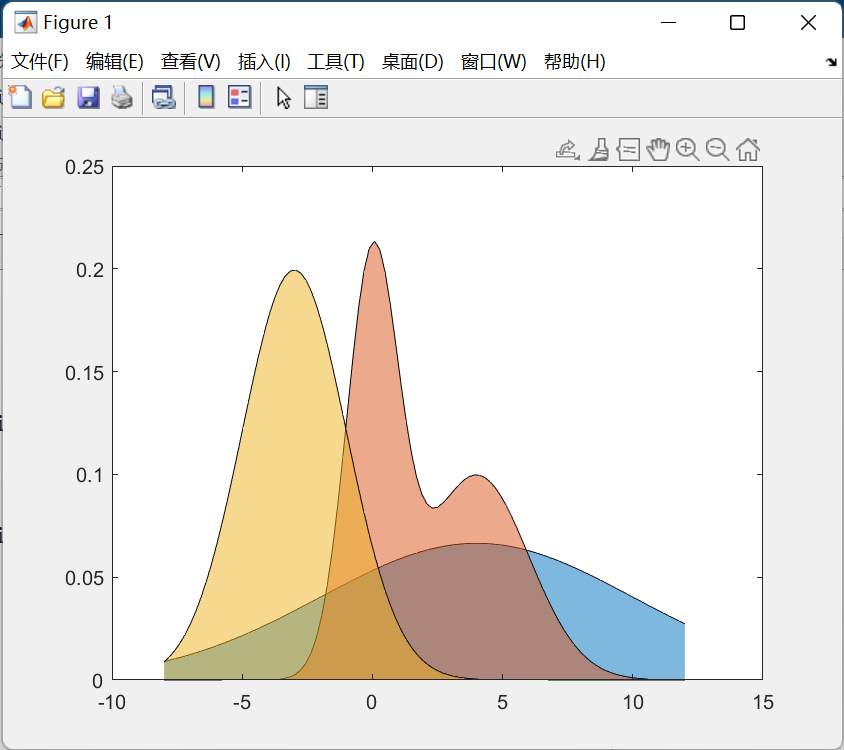
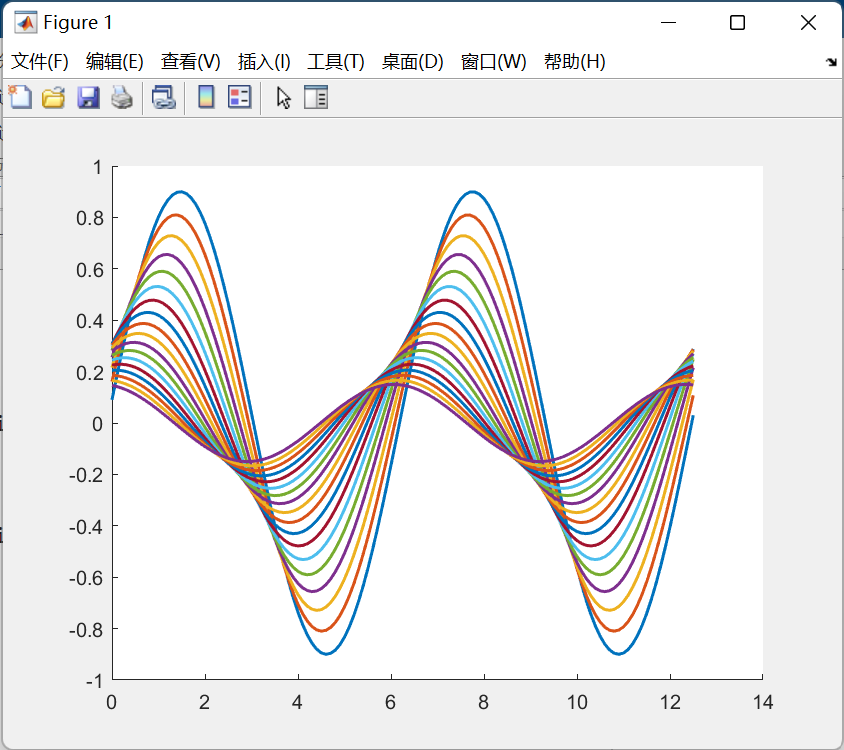 合并为同一fig代码:
fig1=open('1.fig');
fig2=open('2.fig');

figure()
ax1=subplot(2,1,1);
copyobj(fig1.Children.Children,ax1)
delete(fig1)

ax2=subplot(2,1,2);
copyobj(fig2.Children.Children,ax2)
delete(fig2)
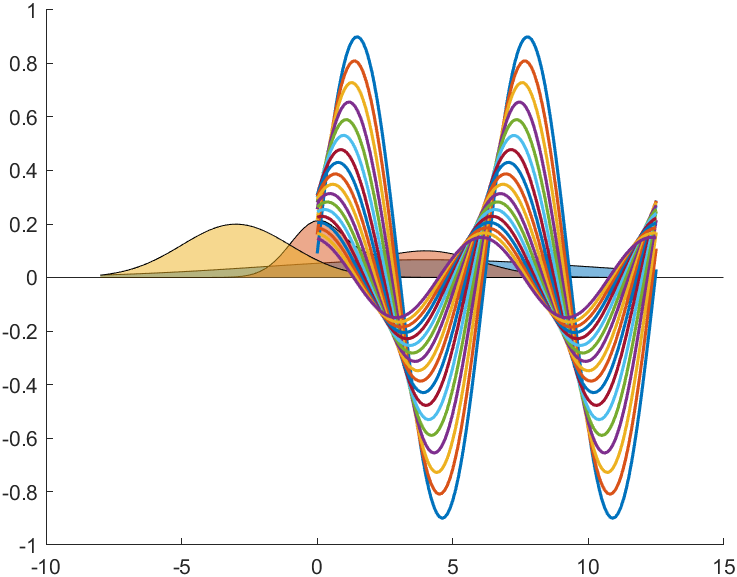
还是用上一部分的fig文件:
fig1=open('1.fig');
fig2=open('2.fig');

figure()
ax=gca;
copyobj(fig1.Children.Children,ax)
copyobj(fig2.Children.Children,ax)

delete(fig1)
delete(fig2)