
- 1. coordinator协调器和worker工作节点
- 2. 查询执行流程
- 3. 查询句法优化
- 4. Lateral join和Semi-join(in)
- 4.1 Lateral join
- 4.2 semi-join(in)
- 5. 基于代价(cost-based optimizer, CBO)的优化
- 5.1 使用表统计信息
Presto/Trino在整个集群的worker服务器上分配处理任务,实现横向拓展,类似MPP架构
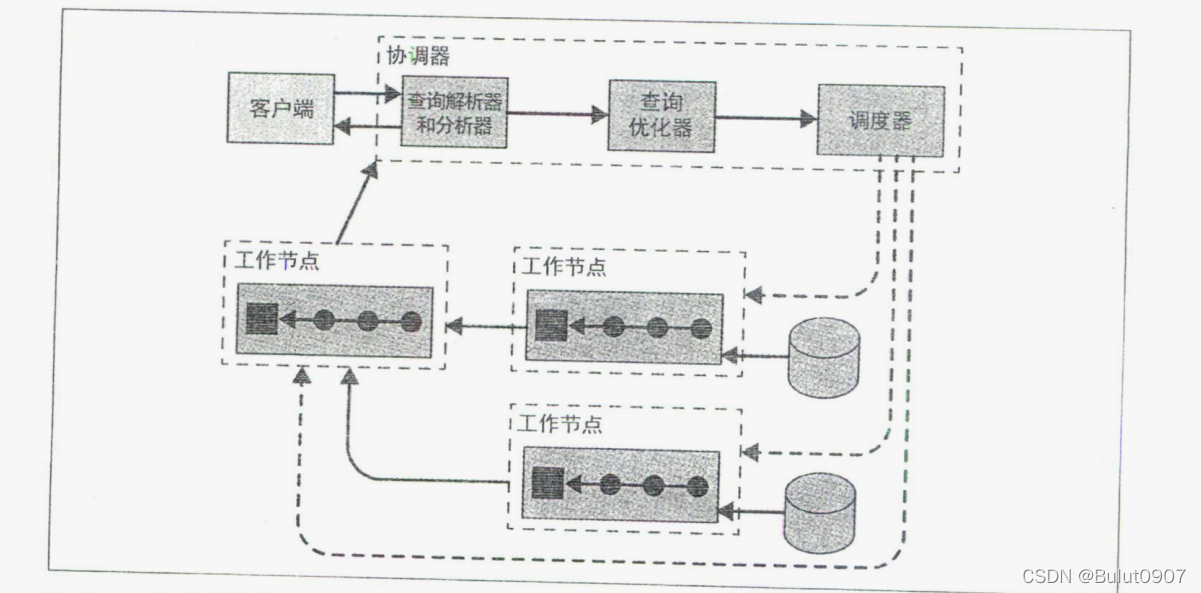 上面是一个coordinator和多个worker的集群,客户端通过coordinator连接系群,coordinator将创建一个包含多个State的逻辑模型,分发到各个worker进行执行,worker访问数据源获取数据
coordinator上会运行一个discovery server节点发现服务(和coordinator共享HTTP服务器,端口相同),worker通过注册到此服务以加入集群,并定期发送心跳信息
客户端、coordinator、worker之间的通信和数据传输都是通过HTTP/HTTPS的Restful API完成
2. 查询执行流程- 客户端向协调器提交SQL
- 协调器用解析器, 调用元数据SPI获取表、列、数据类型信息, 对SQL进行语义校验、类型检查、安全检查
- 协调器用优化器, 调用数据统计SPI获取表大小和行数信息, 进行基于代价的优化
- 然后创建执行计划树, 生成多个stage, 多个stage可以并行处理, stage中的多个task可以在不同的worker上并行处理(看连接器是否支持并行读取表)
- 协调器用调度器, 调用数据位置SPI生成并行处理的task, 调度到worker节点运行
- worker节点调用数据源SPI, 获取数据并转换成列式的的形式, 当task的多个算子执行完毕, 数据被存放到数据缓冲区,下游的stage从该数据缓冲区获取数据
- 最后的stage处理完数据, 返回给客户端
我们先来看一个不进行优化的SQL
trino>
trino> use tpch.sf100000;
USE
trino:sf100000>
trino:sf10000> select (select name from region where regionkey = n.regionkey) as region_name,
            -> n.name as nation_name,
            -> sum(totalprice) orders_sum
            -> from nation n join customer c on n.nationkey = c.nationkey
            -> join orders o on c.custkey = o.custkey
            -> group by n.regionkey, n.nationkey, n.name
            -> order by orders_sum desc
            -> limit 5;
trino:sf100000>
假设region表数据量为R,nation表的数据量为N,customer表数据量为C,orders表数据量为O,假设一个计算的复杂度不会低于其数据量,则运行的复杂度计算如下:
- 读取region、nation、customer、orders表,复杂度分别为R、N、C、O
- nation表和customer表join,复杂度为(N * C)
- 再和orders表join,复杂度为(N * C * O)
- region表和nation表内查询,复杂度为(R * N)
- 排序的复杂度为(N + log( N))
则总的复杂度为(R + N + C + O + N * C + N * C * O + R * N + N + log( N)),忽略小的复杂度,则最终的复杂度为(N * C * O)
假设一个购物网站有1亿用户, 这些用户来自200个国家, 共有10亿订单, 则复杂度为2000亿亿(20 000 000 000 000 000 000行数据), 假如有100个节点, 每个节点每秒可以处理100万行数据, 则需要63世纪才能处理完成
SQL引擎的内部优化方法:
- join会被转化成inner join。如orders表和customer表join,在join的同时就会用关联字段进行数据过滤。此时的复杂度相当于O。所以上面的SQL整体的计算复杂度为(O + R * N + N + log( N))
- TopN优化:将order by和limit合并成一个topN计划,topN计划中动态的新增数据和更新数据,只保留limit条数据,此时计算复杂度为(N + log(limit)),空间复杂度为limit。所以上面的SQL整体的计算复杂度为(O + R * N + N)
- 局部聚合(默认关闭): 不读取全量数据再聚合,以增量的方式读取数据进行累加聚合。如果聚合后的数据量和原数据的数据量变化不大,则还会影响聚合的效果。可以通过参数
set session push_partial_aggregation_through_join = true进行打开,如下所示
trino>
trino> show session like '%push_partial_aggregation_through_join%';
                 Name                  | Value | Default |  Type   |              Description
---------------------------------------+-------+---------+---------+---------------------------------------
 push_partial_aggregation_through_join | true  | false   | boolean | Push partial aggregations below joins
(1 row)

Query 20211231_105553_00010_fgmte, FINISHED, 1 node
Splits: 1 total, 1 done (100.00%)
4.23 [0 rows, 0B] [0 rows/s, 0B/s]

trino>
可以使用reset session push_partial_aggregation_through_join将设置的属性重置到初始值
内查询如下:
trino:sf10000>
trino:sf10000> select(
            -> select name from region r where regionkey = n.regionkey) as region_name,
            -> n.name as nation_name
            -> from nation n;
 region_name |  nation_name
-------------+----------------
 AFRICA      | ALGERIA
 AFRICA      | ETHIOPIA
 ASIA        | INDIA
......省略部分......

Query 20220105_143543_00003_tbrtk, FINISHED, 2 nodes
Splits: 11 total, 11 done (100.00%)
10.41 [30 rows, 0B] [2 rows/s, 0B/s]

trino:sf10000>
trino内部会将上面的查询,转化为left join查询
trino:sf10000>
trino:sf10000> select
            -> r.name as region_name,
            -> n.name as nation_name
            -> from nation n left outer join region r on r.regionkey = n.regionkey;
 region_name |  nation_name
-------------+----------------
 AFRICA      | ALGERIA
 AFRICA      | ETHIOPIA
 ASIA        | INDIA
......省略部分......

Query 20220105_143929_00004_tbrtk, FINISHED, 2 nodes
Splits: 11 total, 11 done (100.00%)
0.85 [30 rows, 0B] [35 rows/s, 0B/s]

trino:sf10000>
区别如下:
- 如果内查询中region表有两条数据的regionkey相同,则会报错
where条件中的in查询如下:
trino:sf10000>
trino:sf10000> select distinct o.orderkey
            -> from orders o join customer c on o.custkey = c.custkey
            -> where c.nationkey in (
            -> select s.nationkey from supplier s);
......省略部分......

trino:sf10000>
内部实现是先对in子查询中的数据进行查询,然后进行数据去重聚合形成临时表,再将临时表和customer表用关联字段进行inner join
5. 基于代价(cost-based optimizer, CBO)的优化Trino中基于代价的优化默认是开启的
trino>
trino> show session like '%join_reordering_strategy%';
           Name           |   Value   |  Default  |  Type   |                                     Description
--------------------------+-----------+-----------+---------+-------------------------------------------------------------------------------------
 join_reordering_strategy | AUTOMATIC | AUTOMATIC | varchar | Join reordering strategy. Possible values: [NONE, ELIMINATE_CROSS_JOINS, AUTOMATIC]
(1 row)

Query 20220106_001652_00020_v7gu7, FINISHED, 1 node
Splits: 1 total, 1 done (100.00%)
3.02 [0 rows, 0B] [0 rows/s, 0B/s]

trino>
两表进行join的时,相同的join key会被分发到相同服务器的同一线程,然后在同一线程中的多条数据进行join处理。Presto/Tino会根据表的数据量进行代价计算,尽量将小表的数据发送到大表所在的服务器,之后会将小表的数据缓存在内存中,提高join性能。而表数据量的计算,是经过where条件过滤后得到的,计算公式为:(1 - 一个列中NULL的比例) * 表中行的数量 / 一个列中不同值的数量
表的统计信息包含如下(需要看连接器是否提供相应项):
- 表中行的数量
- 一个列中不同值的数量,如该列有5种不同的值
- 一个列中NULL的比例
- 一个列中的最大值和最小值
- 一个列的数据平均值或数据平均字符长度
对于类似Hive这种具有分区表功能的数据源,如果命中的数据只在某些分区中,则可以利用一个分区提供的表统计信息,这样会更精确一些
当开启CBO时,Presto/Trino会根据表数据量的大小,自动判断是使用广播join还是分布式join
5.1 使用表统计信息目前已知Hive和PostgreSQL连接器提供了表统计信息。
下面以Hive为例,进行讲解,其它连接器类似。对于Hive连接器,收集统计信息的方式如下:
- 使用Trino的analyze收集表统计信息
- 如果表的数据完全由Trino写入,可以在写入时收集表统计信息
- 使用Hive的analyze收集表统计信息。不推荐使用,Trino使用该统计信息有bug
1. 使用Trino的analyze收集表统计信息
trino>
trino> select * from hive.test_db.test_partition_tb;
 user_id | user_name |  birthday  | country
---------+-----------+------------+---------
       1 | zhang_san | 2018-08-16 | china
(1 row)

Query 20220209_124747_00061_jx84g, FINISHED, 1 node
Splits: 2 total, 2 done (100.00%)
0.66 [1 rows, 374B] [1 rows/s, 565B/s]

trino>
trino>
trino> describe hive.test_db.test_partition_tb;
  Column   |  Type   |     Extra     | Comment
-----------+---------+---------------+---------
 user_id   | bigint  |               |
 user_name | varchar |               |
 birthday  | date    | partition key |
 country   | varchar | partition key |
(4 rows)

Query 20220209_124907_00063_jx84g, FINISHED, 2 nodes
Splits: 4 total, 4 done (100.00%)
0.39 [4 rows, 333B] [10 rows/s, 854B/s]

trino>
trino> analyze hive.test_db.test_partition_tb with (partitions = array[array['2018-08-16', 'china']]);
ANALYZE: 1 row

Query 20220209_124918_00064_jx84g, FINISHED, 2 nodes
Splits: 5 total, 5 done (100.00%)
2.26 [1 rows, 374B] [0 rows/s, 165B/s]

trino>
- 通过Trino的执行引擎计算的统计信息,存放再Hive Metastore中
- 上面的分区指定,外层数组表示多个分区,内层数组表示一个分区的多个分区键
2. 如果表的数据完全由Trino写入,可以在写入时收集表统计信息
优点是不用自己手动执行,而且表统计信息实时更新
开启方法,是在catalog目录下的hive.properties文件中,添加以下属性
hive.collect-column-statistics-on-write=true
3. 查看表统计信息
trino>
trino> show stats for hive.test_db.test_partition_tb;
 column_name | data_size | distinct_values_count | nulls_fraction | row_count | low_value  | high_value
-------------+-----------+-----------------------+----------------+-----------+------------+------------
 user_id     |      NULL |                   1.0 |            0.0 |      NULL | 1          | 1
 user_name   |       9.0 |                   1.0 |            0.0 |      NULL | NULL       | NULL
 birthday    |      NULL |                   1.0 |            0.0 |      NULL | 2018-08-16 | 2018-08-16
 country     |       5.0 |                   1.0 |            0.0 |      NULL | NULL       | NULL
 NULL        |      NULL |                  NULL |           NULL |       1.0 | NULL       | NULL
(5 rows)

Query 20220209_125330_00065_jx84g, FINISHED, 1 node
Splits: 1 total, 1 done (100.00%)
0.78 [0 rows, 0B] [0 rows/s, 0B/s]

trino>
trino>
trino> show stats for (select * from hive.test_db.test_partition_tb where birthday = date '2018-08-16');
 column_name | data_size | distinct_values_count | nulls_fraction | row_count | low_value  | high_value
-------------+-----------+-----------------------+----------------+-----------+------------+------------
 user_id     |      NULL |                   1.0 |            0.0 |      NULL | 1          | 1
 user_name   |       9.0 |                   1.0 |            0.0 |      NULL | NULL       | NULL
 birthday    |      NULL |                   1.0 |            0.0 |      NULL | 2018-08-16 | 2018-08-16
 country     |       5.0 |                   1.0 |            0.0 |      NULL | NULL       | NULL
 NULL        |      NULL |                  NULL |           NULL |       1.0 | NULL       | NULL
(5 rows)

Query 20220209_125429_00066_jx84g, FINISHED, 1 node
Splits: 1 total, 1 done (100.00%)
0.49 [0 rows, 0B] [0 rows/s, 0B/s]

trino>

