
在前面的文章中介绍了Kubernetes和Prometheus进行集成的常见方式,这篇文章结合具体的示例介绍一下如何监控Kubernetes的Node。
集成Api Server 集成方式Kubernetes主要提供了如下5种服务发现模式和Prometheus进行集成:
- Node
- Pod
- Endpoints
- Service
- Ingress
监控Node主要需要使用nodes服务发现模式,配置方式如下所示
Node服务发现模式kubernetes_sd_configs: - role: node监控方法 监控对象 监控指标内容 服务发现模式 监控方式 数据来源 集群各节点Kubelet组件 各节点Kubelet的基本运行状态相关的监控指标 node 白盒监控 Kubelet Kubernetes环境准备
本文使用Kubernetes 1.17,可参看下文进行快速环境搭建:
- 单机版本或者集群版本环境搭建
[root@host131 ~]# kubectl get nodes -o wide
NAME              STATUS   ROLES    AGE    VERSION   INTERNAL-IP       EXTERNAL-IP   OS-IMAGE                KERNEL-VERSION          CONTAINER-RUNTIME
192.168.163.131   Ready116m   v1.17.0   192.168.163.131CentOS Linux 7 (Core)   3.10.0-957.el7.x86_64   docker://18.9.7
[root@host131 ~]#
RBAC配置文件
准备如下RBAC配置文件
[root@host131 node]# cat rbac.yml --- apiVersion: rbac.authorization.k8s.io/v1 kind: ClusterRole metadata: name: prometheus rules: - apiGroups: [""] resources: - nodes - nodes/proxy verbs: ["get", "list", "watch"] - nonResourceURLs: ["/metrics"] verbs: ["get"] --- apiVersion: rbac.authorization.k8s.io/v1 kind: ClusterRoleBinding metadata: name: prometheus roleRef: apiGroup: rbac.authorization.k8s.io kind: ClusterRole name: prometheus subjects: - kind: ServiceAccount name: default namespace: default [root@host131 node]#ConfigMap设定文件
ConfigMap设定文件如下所示:
[root@host131 node]# cat configmap.yml apiVersion: v1 kind: ConfigMap metadata: name: prometheus-configmap labels: name: prometheus-configmap namespace: default data: prometheus.yml: |- global: scrape_interval: 5s evaluation_interval: 5s scrape_configs: - job_name: 'k8s-nodes' scheme: https tls_config: ca_file: /var/run/secrets/kubernetes.io/serviceaccount/ca.crt bearer_token_file: /var/run/secrets/kubernetes.io/serviceaccount/token kubernetes_sd_configs: - role: node relabel_configs: - action: labelmap regex: __meta_kubernetes_node_label_(.+) - target_label: __address__ replacement: kubernetes.default.svc:443 - source_labels: [__meta_kubernetes_node_name] regex: (.+) target_label: __metrics_path__ replacement: /api/v1/nodes/${1}/proxy/metrics [root@host131 node]#
Deployment配置文件
Deployment与Service等配置文件内容如下所示:
[root@host131 node]# cat deployment.yml --- apiVersion: v1 kind: Service metadata: name: prometheus-service namespace: default annotations: prometheus.io/scrape: 'true' prometheus.io/port: '9090' spec: selector: app: prometheus-deployment type: NodePort ports: - port: 8080 targetPort: 9090 nodePort: 33308 ... --- apiVersion: apps/v1 kind: Deployment metadata: name: prometheus-deployment namespace: default spec: replicas: 1 selector: matchLabels: app: prometheus-deployment template: metadata: labels: app: prometheus-deployment spec: containers: - name: prometheus image: prom/prometheus:v2.15.1 args: - "--config.file=/etc/prometheus/prometheus.yml" - "--storage.tsdb.path=/prometheus/" ports: - containerPort: 9090 volumeMounts: - name: prometheus-configmap mountPath: /etc/prometheus/ - name: prometheus-storage-volume mountPath: /prometheus/ volumes: - name: prometheus-configmap configMap: defaultMode: 420 name: prometheus-configmap - name: prometheus-storage-volume emptyDir: {} [root@host131 node]#
启动Prometheus服务
[root@host131 node]# ls
configmap.yml  deployment.yml  rbac.yml
[root@host131 node]# kubectl create -f .
configmap/prometheus-configmap created
service/prometheus-service created
deployment.apps/prometheus-deployment created
clusterrole.rbac.authorization.k8s.io/prometheus created
clusterrolebinding.rbac.authorization.k8s.io/prometheus created
[root@host131 node]#
结果确认
[root@host131 node]# kubectl get pods
NAME                                     READY   STATUS    RESTARTS   AGE
prometheus-deployment-774dcd78bc-jlxx7   1/1     Running   0          33s
[root@host131 node]# kubectl get deployments
NAME                    READY   UP-TO-DATE   AVAILABLE   AGE
prometheus-deployment   1/1     1            1           39s
[root@host131 node]# kubectl get service
NAME                 TYPE        CLUSTER-IP      EXTERNAL-IP   PORT(S)          AGE
kubernetes           ClusterIP   10.254.0.1443/TCP          10h
prometheus-service   NodePort    10.254.157.338080:33308/TCP   51s
[root@host131 node]#
确认连接信息
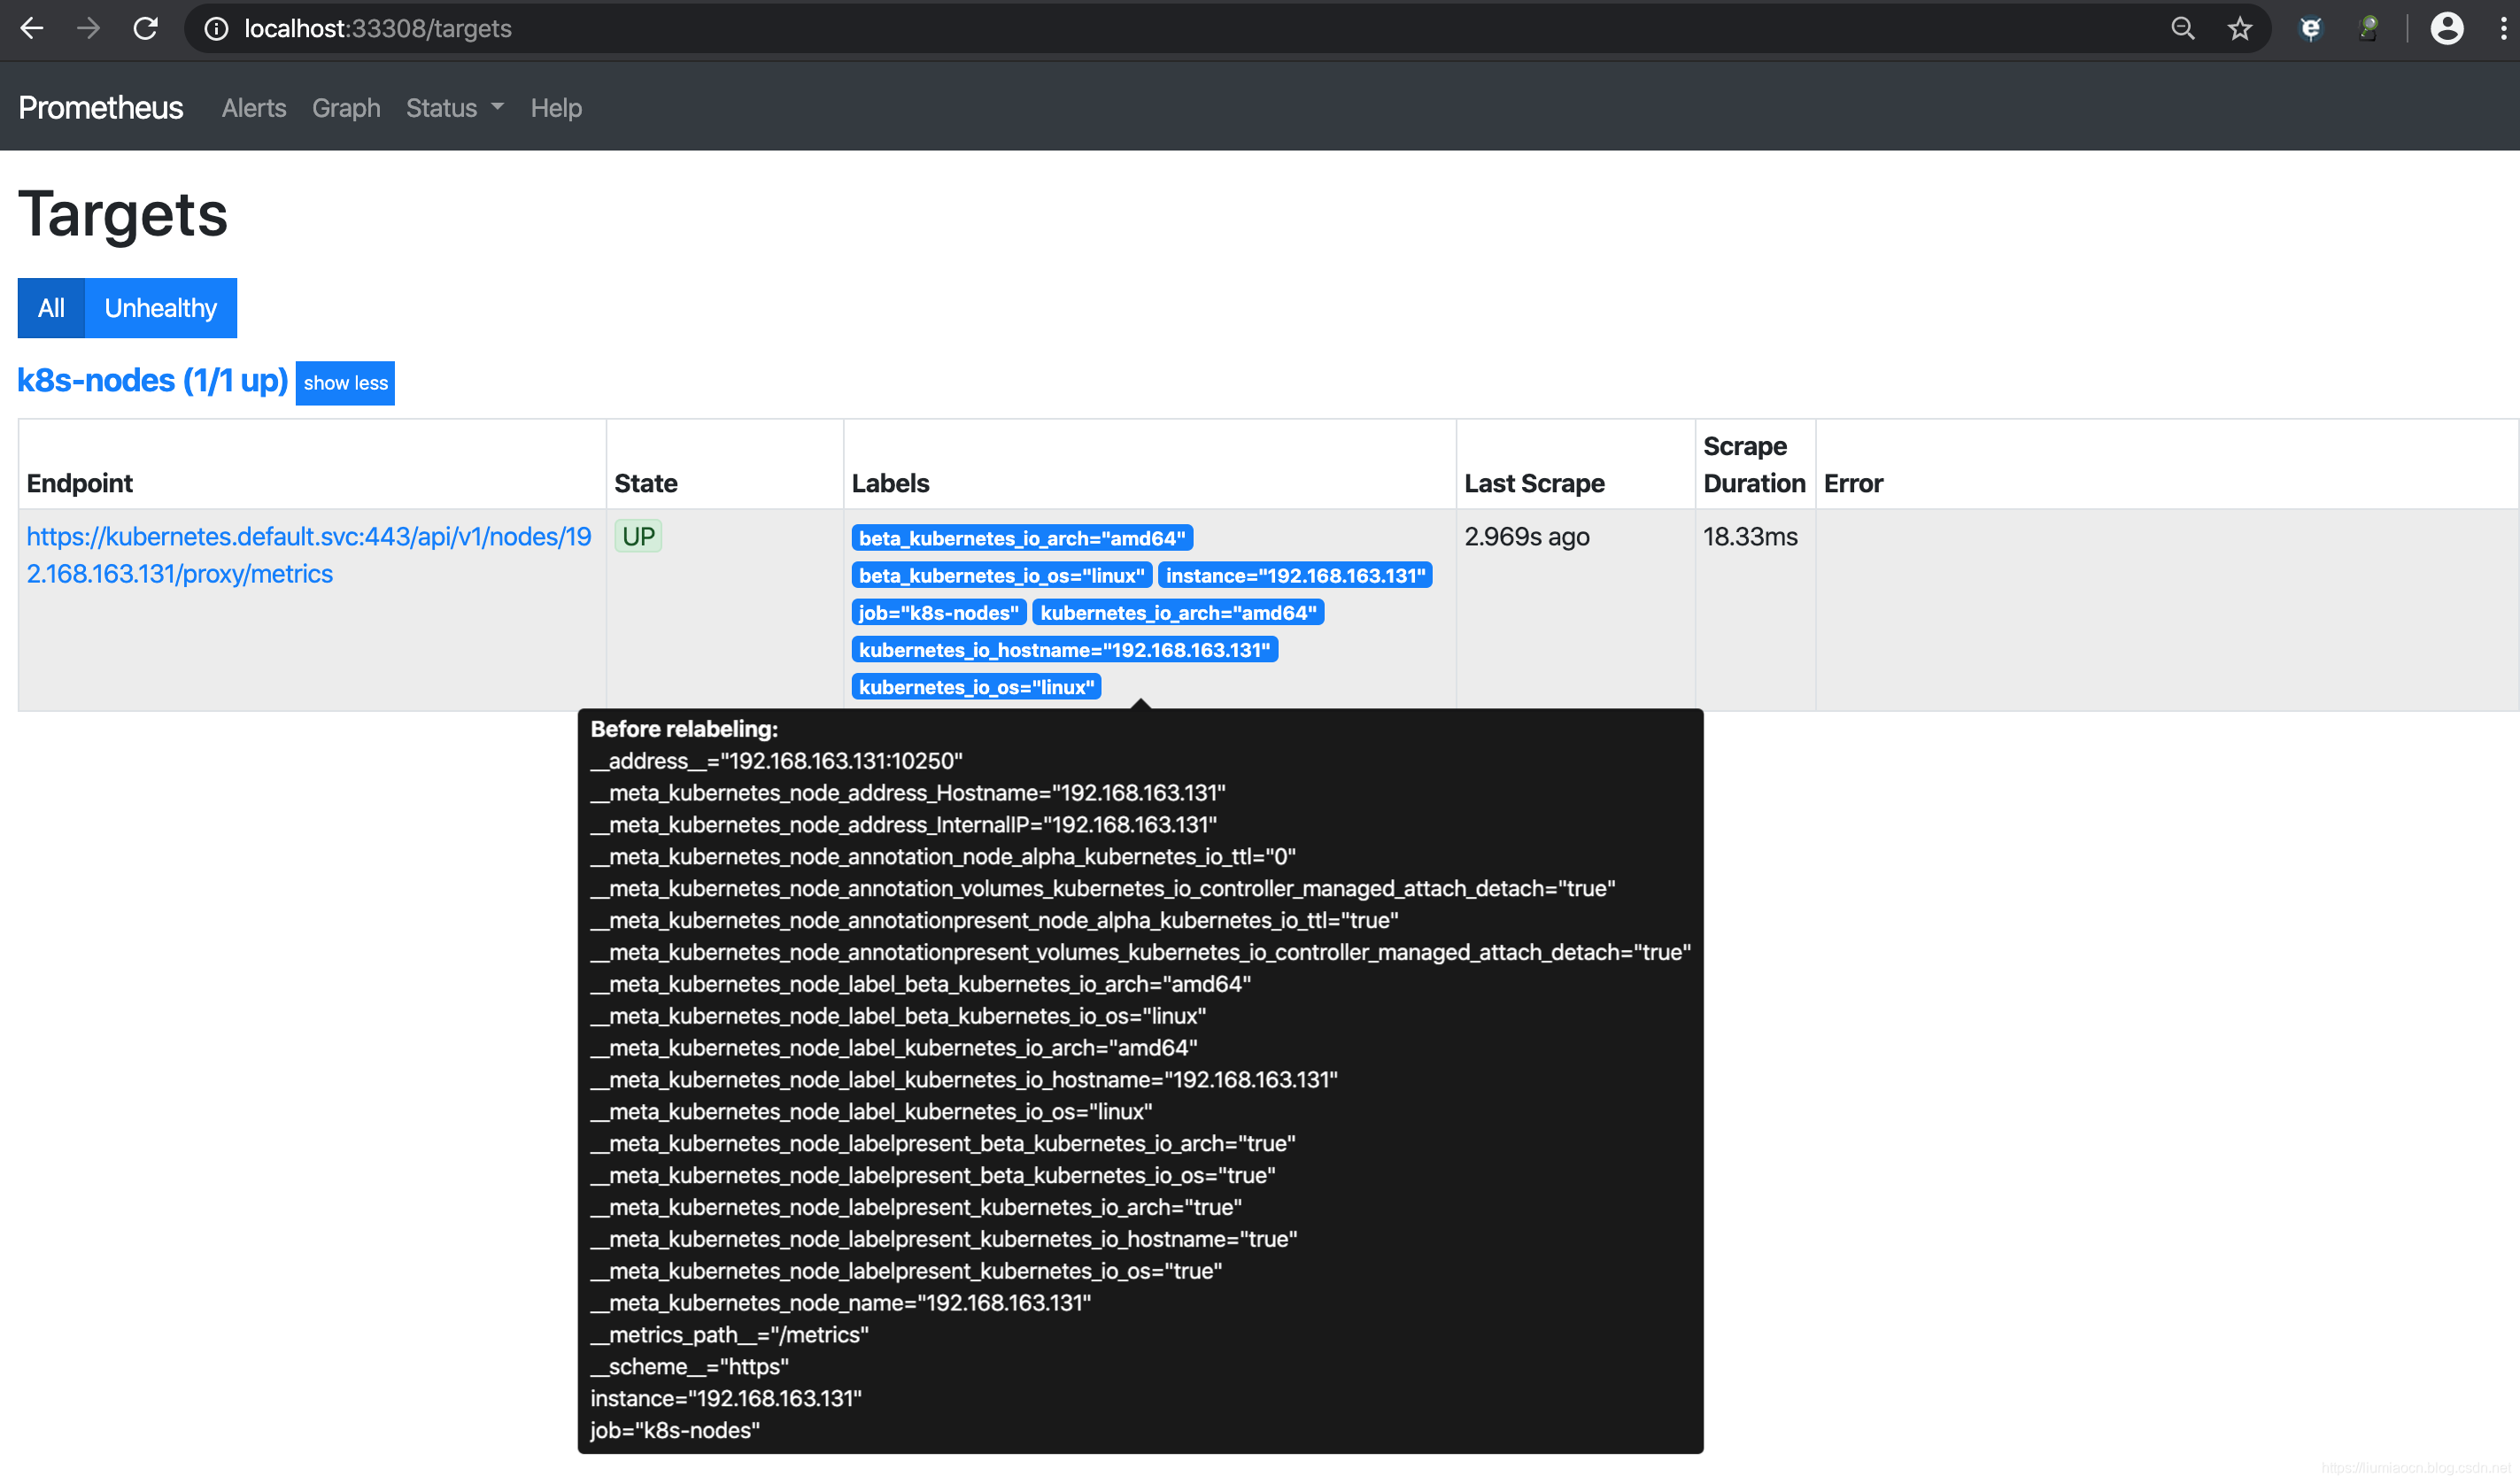
确认UP信息
 从/targets链接也可以同样确认到UP的信息
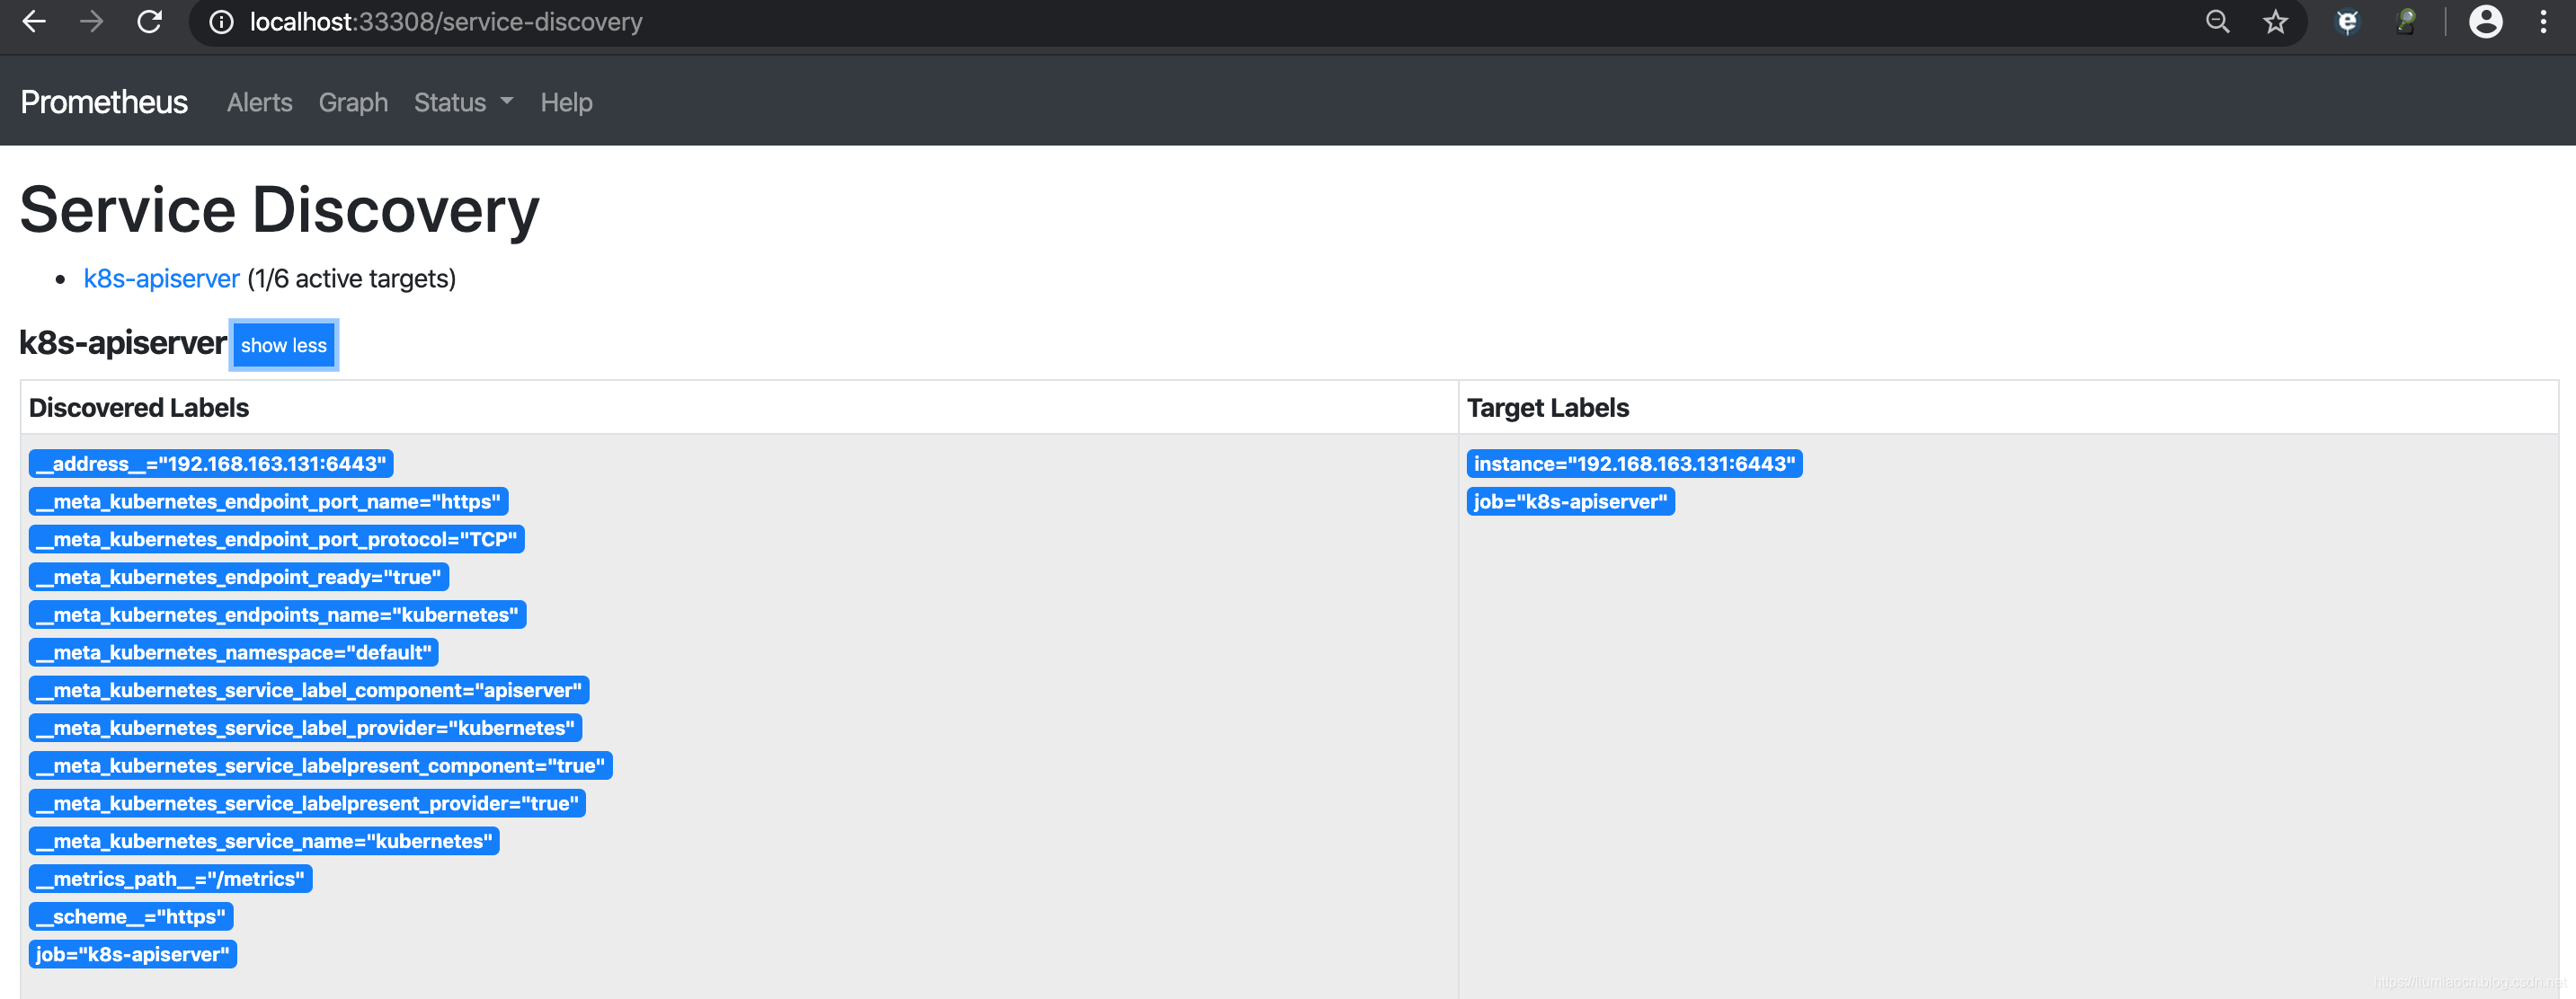
 服务发现的信息
上述配置文件同样存放在Easypack中,URL地址链接为:
- https://github.com/liumiaocn/easypack/tree/master/monitor/prometheus/kubernetes/node

