

全网唯一这四个字我都快说腻了,请叫我绘图小天才,又双叒叕写了一个工具函数发到了MATHWORKS,矩形树状图主要用于直观展示各个元素的分类和占比。
编写不易点个赞叭~~
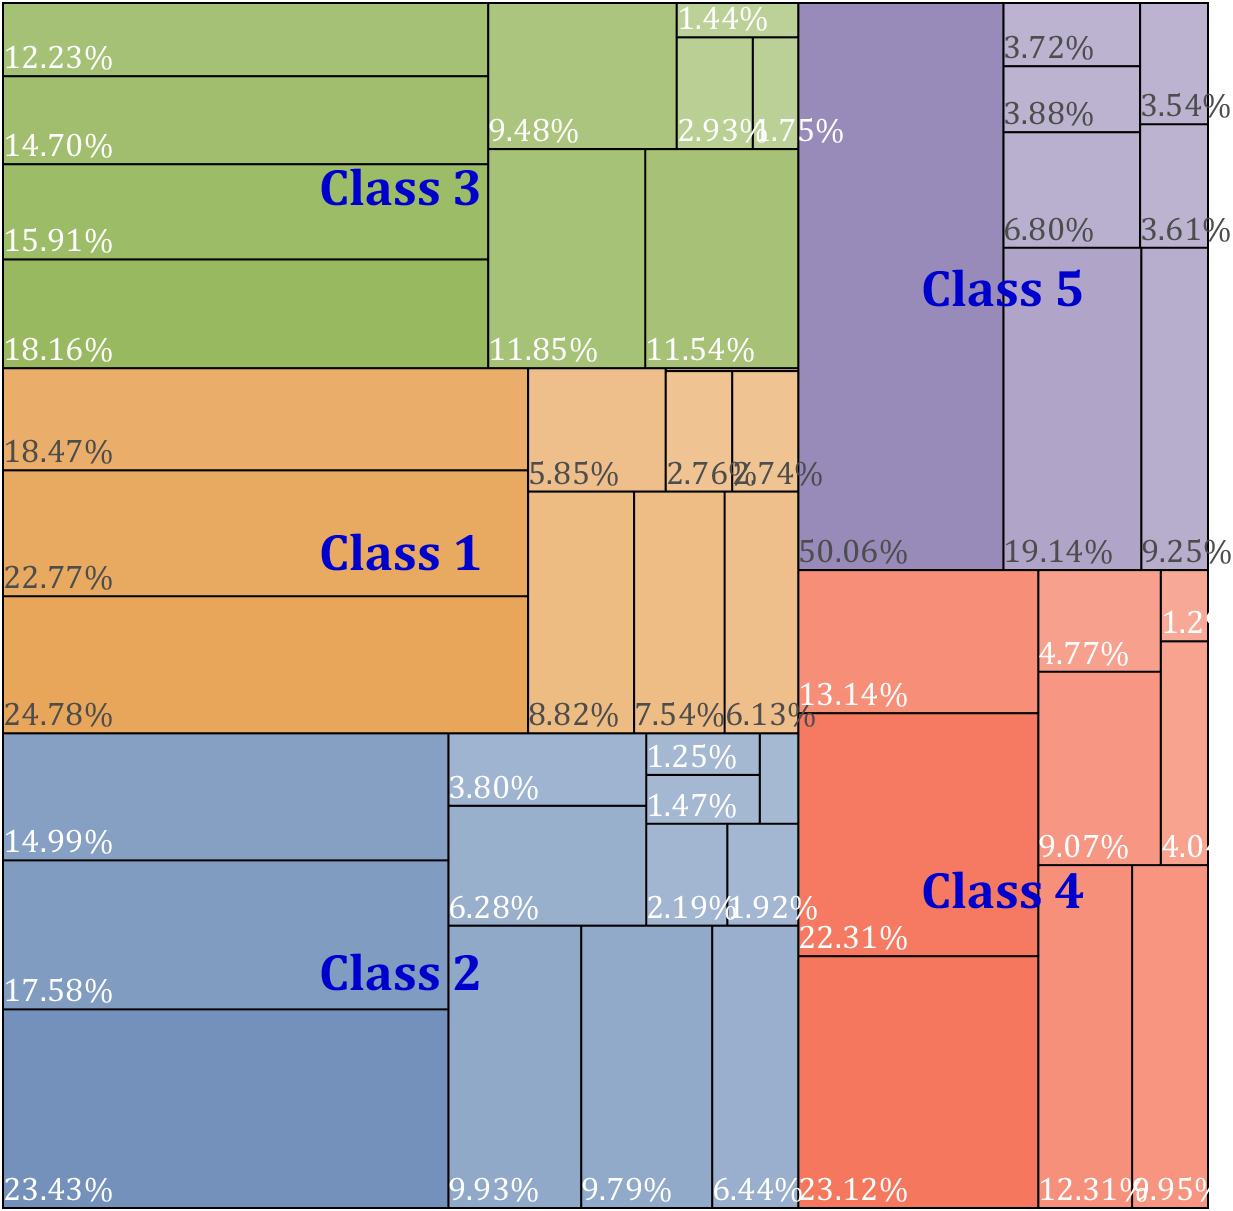
基本使用需要准备一组大于0的数据,以及每个数据的分类情况,例如我随即生成50个数据并将其随机分到1-5类中,占比越大的类绘制出来越靠近左下角:
% 随机生成数据及分类 Data=rand(1,50).*linspace(10,100,50); Class=randi([1,5],[50,1]); % 绘图
CT=rectTree(Data,Class); CT=CT.draw();
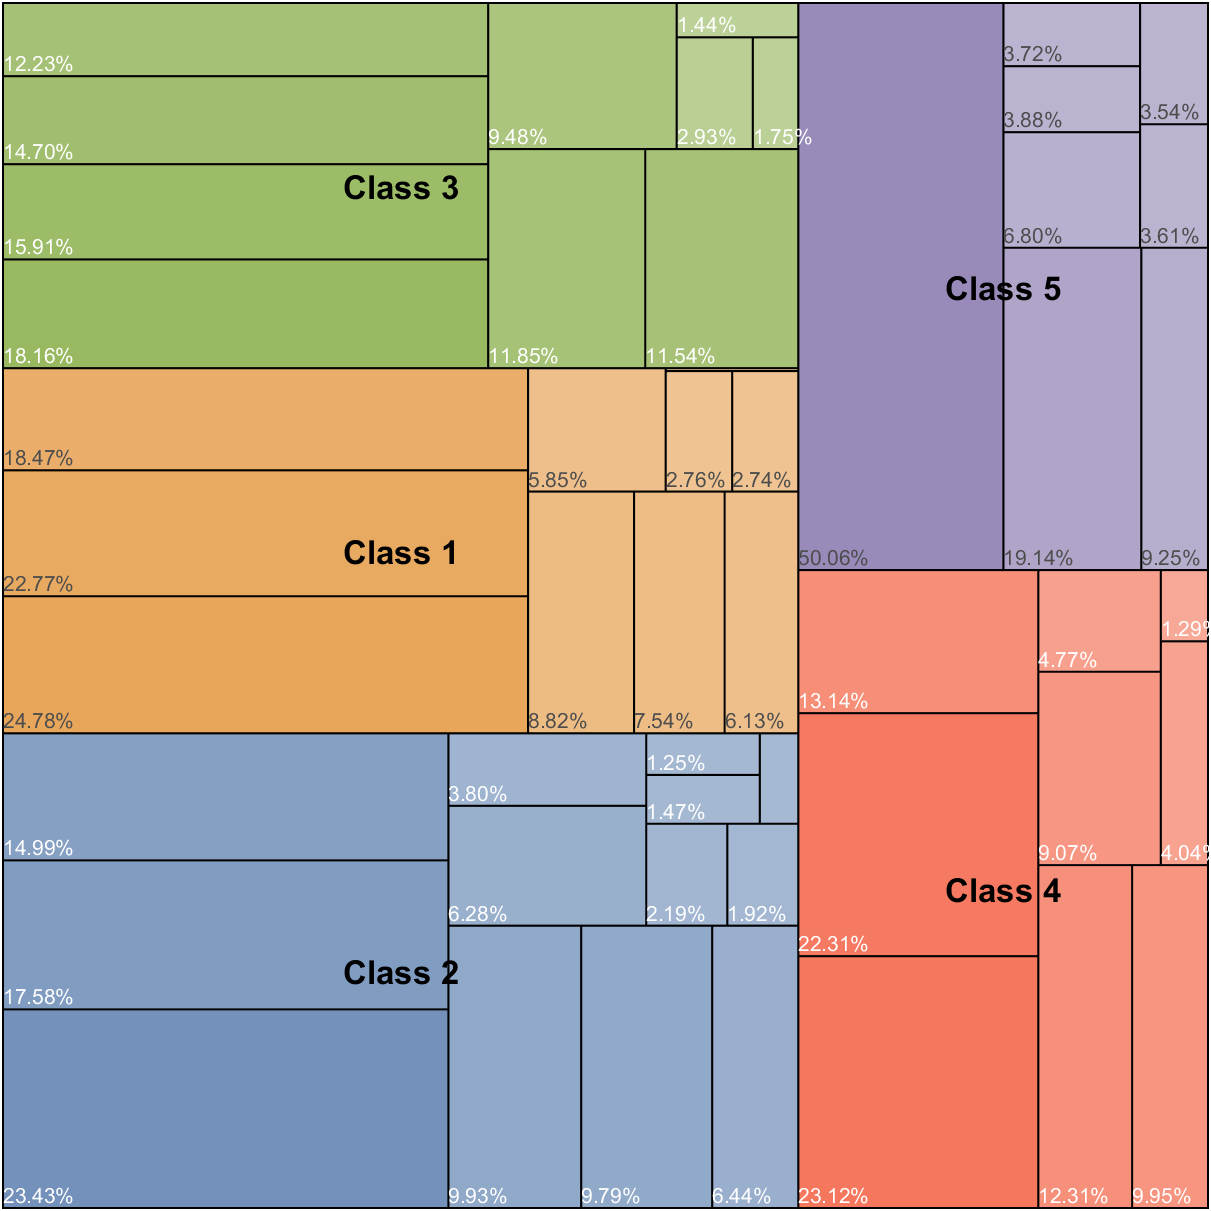
可以看出如果没有特意设置各个类的名字和各个元素的名字,各类就会取名Class n各个元素就会显示占这个类的比例。
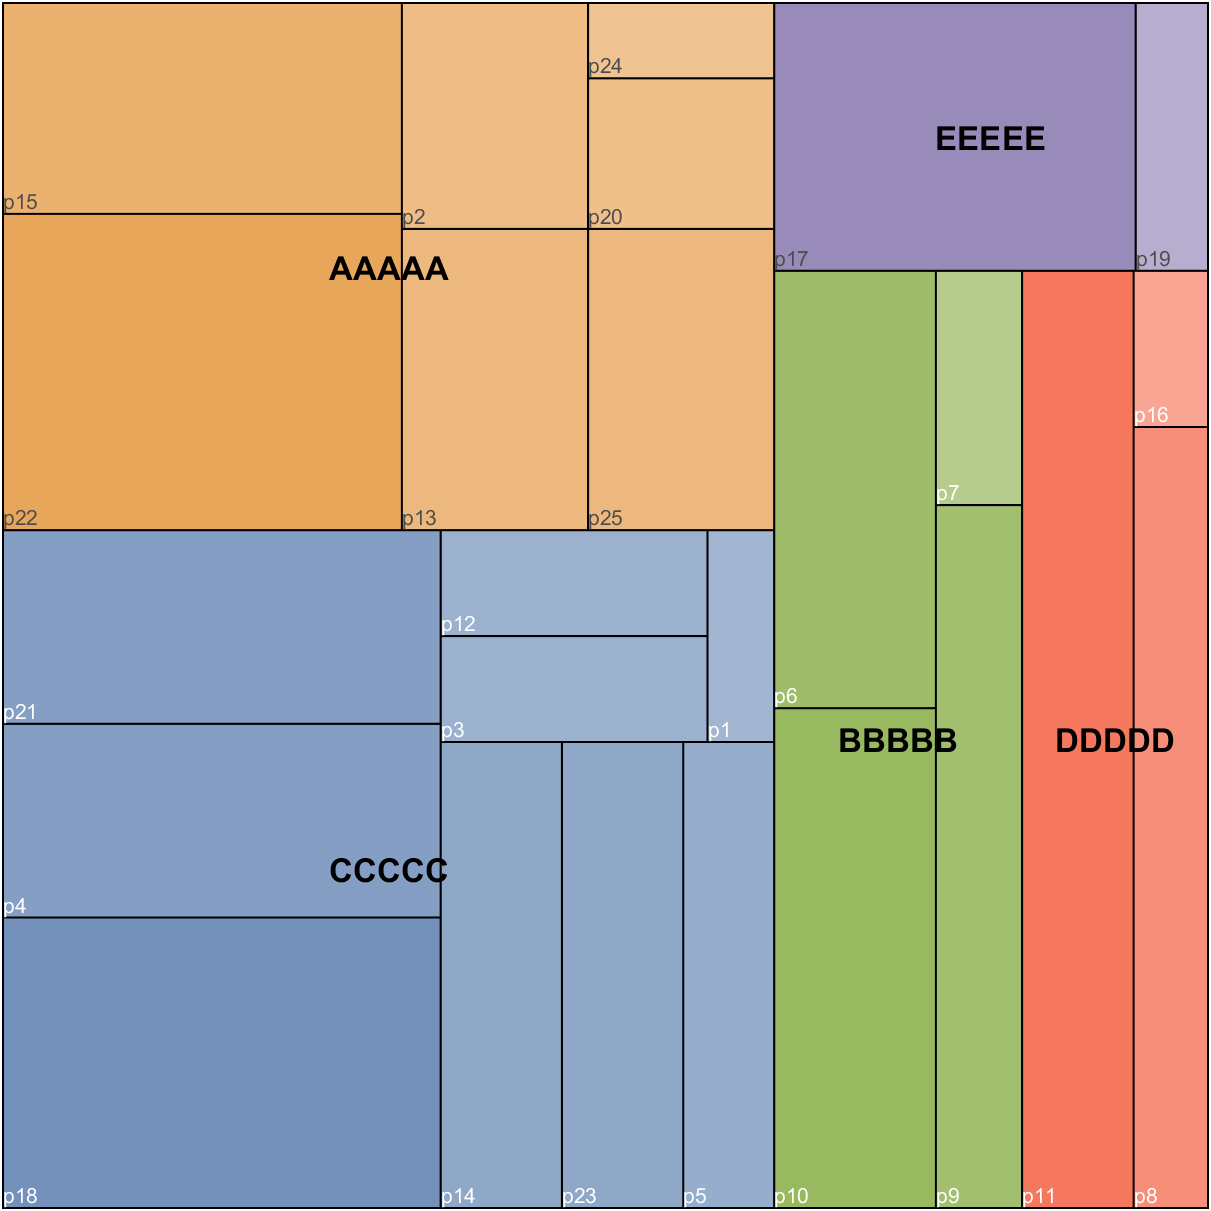
设置类名和元素名举个实例
Data=[1;3;2;6;3;7;2;5;6;8;9;2;4;4;6;1;5;9;1;2;6;9;4;1;4]; Class=randi([1,5],[25,1]); for i=1:length(Data) Name{i}=['p',num2str(i)]; end ClassName={'AAAAA','BBBBB','CCCCC','DDDDD','EEEEE'}; CT=rectTree(Data,Class,'Name',Name,'ClassName',ClassName); CT=CT.draw();
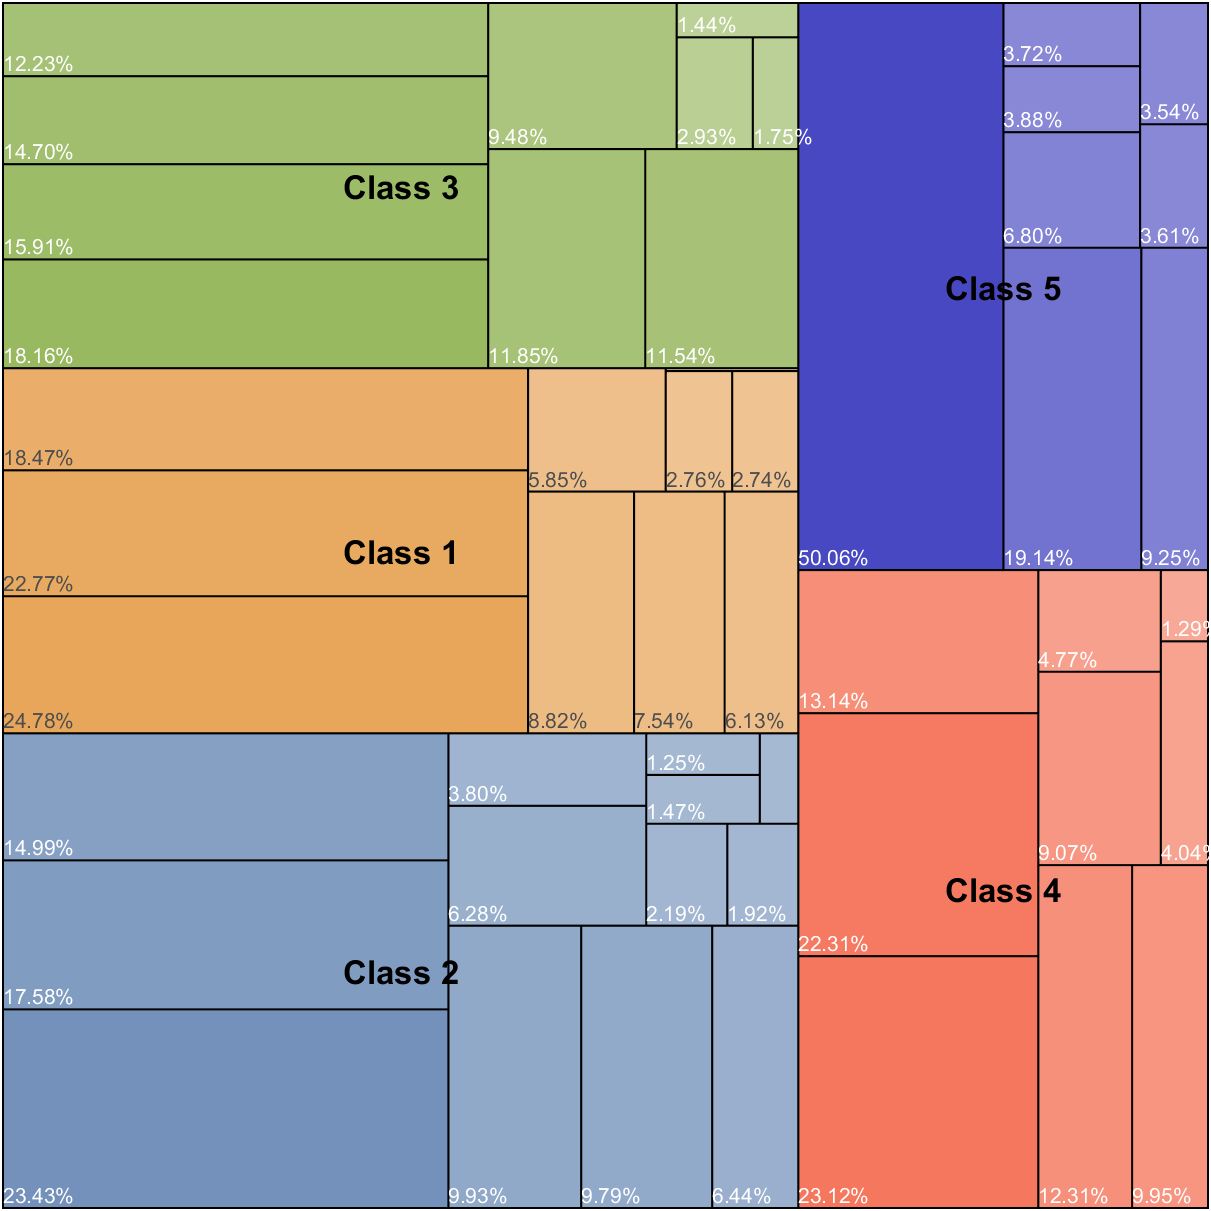
使用setColor(N,color)设置每一类的颜色,例如设置第五类为蓝色:
CT.setColor(5,[.1,.1,.7]);
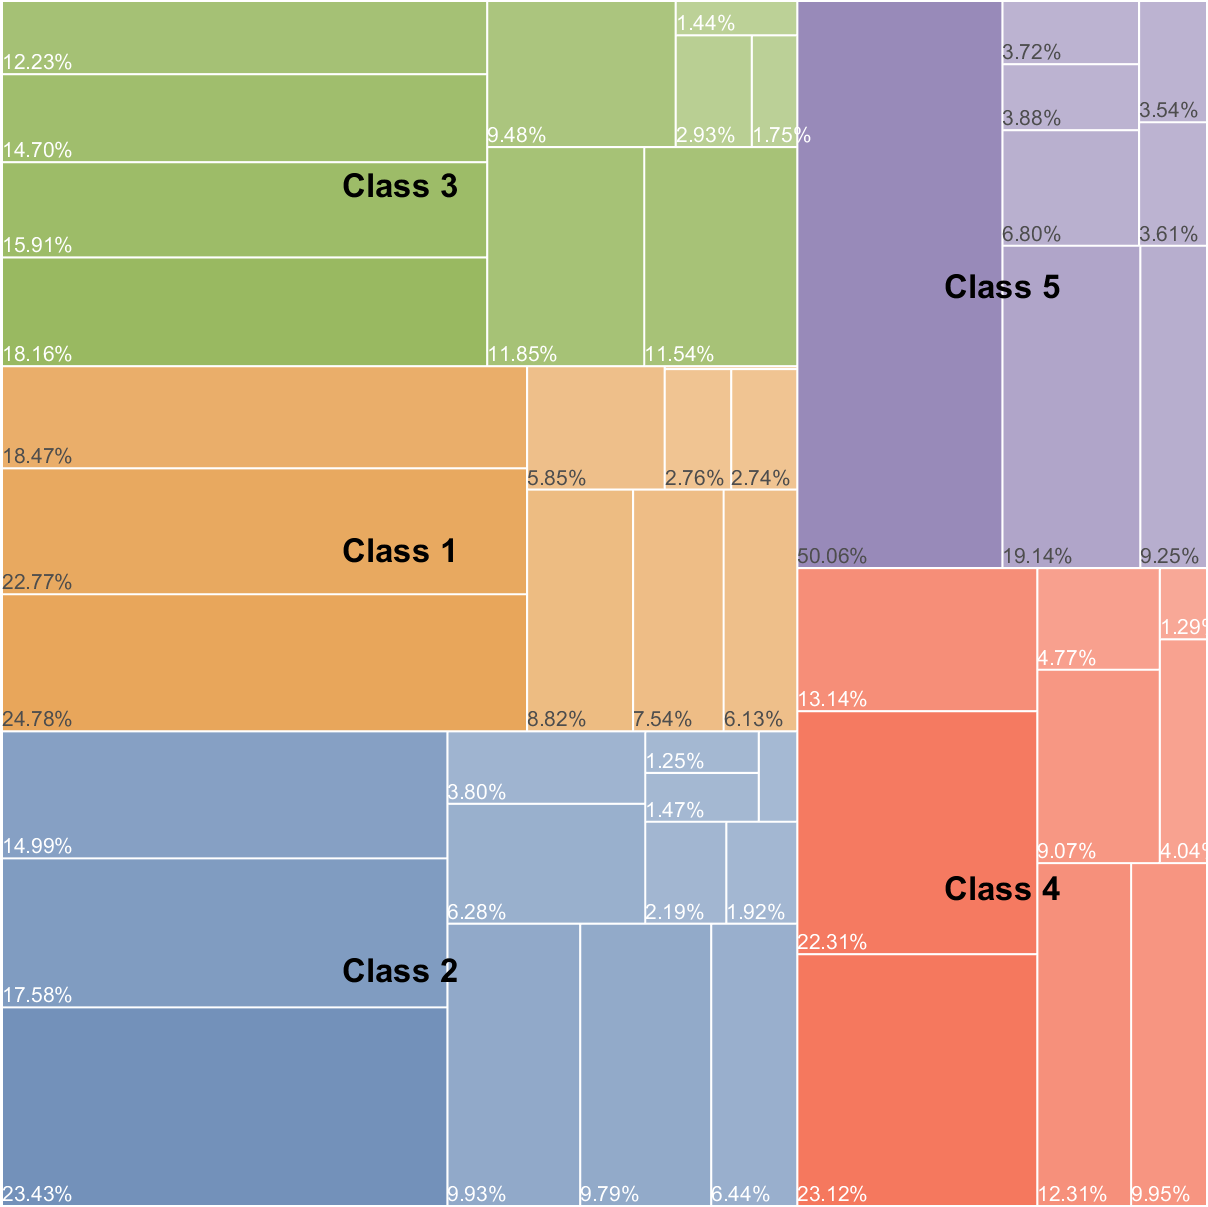
使用setPatch(varargin)设置其他属性,patch对象具有的属性均可被设置(例如把边缘变成白色):
CT.setPatch('EdgeColor',[1,1,1])
使用
- setFont(varargin)
- setLabel(varargin)
分别设置元素标签和类标签的字体,举个例子:
CT.setFont('FontName','Cambria','FontSize',16) CT.setLabel('FontName','Cambria','FontSize',25,'Color',[0,0,.8])
classdef rectTree % @author : slandarer % gzh : slandarer随笔

    properties
        ax,Data,Class,varargin,CS,HS,index,hdlSet
        arginList={'ColorOrder','Name','ClassName'} classNum=1; classSet=[]; classRatio=[]; ColorOrder=[80,118,169;226,144,50;127,167,58;242,86,54;126,109,167; 196,98,37;74,148,189;255,182,46;161,86,144;134,138,33; 240,73,53;90,123,207;254,147,44;186,79,115;35,170,102]./255; Name=[]; ClassName=[]; posSet=zeros(0,4); end

    methods
        function obj=rectTree(Data,Class,varargin) obj.Data=Data(:); obj.Class=Class(:); obj.classSet=unique(Class); obj.classNum=length(obj.classSet); obj.Name{length(Class)}=''; % 计算比例 for i=1:obj.classNum
                obj.classRatio(i)=sum(obj.classSet(i)==obj.Class); end
            obj.classRatio=obj.classRatio./sum(obj.classRatio); % 获取其他数据 for i=1:2:(length(varargin)-1) tid=ismember(obj.arginList,varargin{i}); if any(tid) obj.(obj.arginList{tid})=varargin{i+1}; end
            end [~,tind]=sort(obj.classRatio,'descend'); obj.classRatio=obj.classRatio(tind); obj.classSet=obj.classSet(tind); if length(obj.ClassName)<obj.classNum for i=1:obj.classNum obj.ClassName{i}=['Class ',num2str(i)]; end
            end
            obj.index=tind; obj.ClassName=obj.ClassName(tind); obj.varargin=varargin; end

        function obj=draw(obj) obj.ax=gca;hold on obj.ax.XLim=[0,1]; obj.ax.YLim=[0,1]; obj.ax.XTick=[]; obj.ax.YTick=[]; obj.ax.XColor='none'; obj.ax.YColor='none'; obj.ax.PlotBoxAspectRatio=[1,1,1]; % ============================================================= % 计算各类位置(obj.posSet) tClassRatio=obj.classRatio; tCumClassRatio=cumsum(tClassRatio); meanPos=[0,0,1,1]; typeInd=1; for i=1:obj.classNum
                p5Index=find(tCumClassRatio>.5,1); switch(typeInd) case 1 tPos=meanPos; meanPos=tPos;compPos=tPos; meanPos(3)=tPos(3).*tCumClassRatio(p5Index); compPos(1)=tPos(1)+tPos(3).*tCumClassRatio(p5Index); compPos(3)=tPos(3).*(1-tCumClassRatio(p5Index)); case 0 tPos=meanPos; meanPos=tPos;compPos=tPos; meanPos(4)=tPos(4).*tCumClassRatio(p5Index); compPos(2)=tPos(2)+tPos(4).*tCumClassRatio(p5Index); compPos(4)=tPos(4).*(1-tCumClassRatio(p5Index)); end
                tClassPartRatio=tCumClassRatio(1:p5Index); disp(char([64 97 117 116 104 111 114 32 58 32 115 108 97 110 100 97 114 101 114])) tClassPartRatio=[0,tClassPartRatio./max(tClassPartRatio)]; for j=1:p5Index switch(typeInd) case 1 tPos=meanPos; obj.posSet=[obj.posSet;tPos(1),tPos(2)+tPos(4)*tClassPartRatio(j),... tPos(3),tPos(4)*(tClassPartRatio(j+1)-tClassPartRatio(j))]; case 0 tPos=meanPos; obj.posSet=[obj.posSet;tPos(1)+tPos(3)*tClassPartRatio(j),tPos(2),... tPos(3)*(tClassPartRatio(j+1)-tClassPartRatio(j)),tPos(4)]; end
                end
                meanPos=compPos; typeInd=mod(typeInd+1,2); tClassRatio(1:p5Index)=[]; if isempty(tClassRatio),break;end
                tClassRatio=tClassRatio./sum(tClassRatio); tCumClassRatio=cumsum(tClassRatio); end % ============================================================= % 计算各类矩形树位置 for n=1:obj.classNum % drawSquare(obj.posSet(n,:),obj.ColorOrder(n,:)); tRatio=obj.Data(obj.classSet(n)==obj.Class); tRatio=tRatio(:).'; tRatio=tRatio./sum(tRatio); [~,tind]=sort(tRatio,'descend'); tRatio=tRatio(tind); obj.CS(n).R=tRatio; obj.CS(n).P=zeros(0,4); obj.CS(n).S=obj.Name(obj.classSet(n)==obj.Class); obj.CS(n).S=obj.CS(n).S(tind); tCumRatio=cumsum(tRatio); meanPos=obj.posSet(n,:); typeInd=1; % --------------------------------------------------------- for i=1:length(tRatio) p5Index=find(tCumRatio>.5,1); switch(typeInd) case 1 tPos=meanPos; meanPos=tPos;compPos=tPos; meanPos(3)=tPos(3).*tCumRatio(p5Index); compPos(1)=tPos(1)+tPos(3).*tCumRatio(p5Index); compPos(3)=tPos(3).*(1-tCumRatio(p5Index)); case 0 tPos=meanPos; meanPos=tPos;compPos=tPos; meanPos(4)=tPos(4).*tCumRatio(p5Index); compPos(2)=tPos(2)+tPos(4).*tCumRatio(p5Index); compPos(4)=tPos(4).*(1-tCumRatio(p5Index)); end
                    tPartRatio=tCumRatio(1:p5Index); tPartRatio=[0,tPartRatio./max(tPartRatio)]; for j=1:p5Index switch(typeInd) case 1 tPos=meanPos; obj.CS(n).P=[obj.CS(n).P;tPos(1),tPos(2)+tPos(4)*tPartRatio(j),... tPos(3),tPos(4)*(tPartRatio(j+1)-tPartRatio(j))]; case 0 tPos=meanPos; obj.CS(n).P=[obj.CS(n).P;tPos(1)+tPos(3)*tPartRatio(j),tPos(2),... tPos(3)*(tPartRatio(j+1)-tPartRatio(j)),tPos(4)]; end
                    end
                    meanPos=compPos; typeInd=mod(typeInd+1,2); tRatio(1:p5Index)=[]; if isempty(tRatio),break;end
                    tRatio=tRatio./sum(tRatio); tCumRatio=cumsum(tRatio); end % --------------------------------------------------------- end % ============================================================= % 绘制矩形树状图 for n=1:obj.classNum for i=1:size(obj.CS(n).P,1) obj.hdlSet(n).P(i)=drawSquare(obj.CS(n).P(i,:),obj.ColorOrder(n,:),obj.CS(n).R(i)./max(obj.CS(n).R).*.3+.5); end
            end for n=1:obj.classNum if mean(obj.ColorOrder(n,:))>.5 tColor=[.3,.3,.3]; else tColor=[1,1,1]; end for i=1:size(obj.CS(n).P,1) if obj.CS(n).R(i)>1e-2&&isempty(obj.CS(n).S{i}) obj.hdlSet(n).T(i)=text(obj.CS(n).P(i,1),obj.CS(n).P(i,2),... [sprintf('%.2f',obj.CS(n).R(i)*100),'%'],'VerticalAlignment','bottom','Color',tColor); elseif ~isempty(obj.CS(n).S{i}) obj.hdlSet(n).T(i)=text(obj.CS(n).P(i,1),obj.CS(n).P(i,2),... obj.CS(n).S{i},'VerticalAlignment','bottom','Color',tColor); end
                end
            end for n=1:obj.classNum
                obj.hdlSet(n).C=text(obj.posSet(n,1)+obj.posSet(n,3)/2,... obj.posSet(n,2)+obj.posSet(n,4)/2,... obj.ClassName{n},'FontSize',16,'FontWeight','bold',... 'HorizontalAlignment','center'); end
            function sqHdl=drawSquare(pos,color,alpha) sqHdl=fill([pos(1),pos(1)+pos(3),pos(1)+pos(3),pos(1)],... [pos(2),pos(2),pos(2)+pos(4),pos(2)+pos(4)],color,... 'EdgeColor','k','FaceAlpha',alpha,'LineWidth',1); end
        end % ================================================================= function setColor(obj,N,color) for n=find(obj.index==N) if mean(color)>.5 tColor=[.3,.3,.3]; else tColor=[1,1,1]; end for i=1:length(obj.hdlSet(n).P) set(obj.hdlSet(n).P(i),'FaceColor',color) end for i=1:length(obj.hdlSet(n).T) set(obj.hdlSet(n).T(i),'Color',tColor) end
            end
        end
        function setPatch(obj,varargin) for n=1:obj.classNum for i=1:length(obj.hdlSet(n).P) set(obj.hdlSet(n).P(i),varargin{:}) end
            end
        end
        function setFont(obj,varargin) for n=1:obj.classNum for i=1:length(obj.hdlSet(n).T) set(obj.hdlSet(n).T(i),varargin{:}) end
            end
        end
        function setLabel(obj,varargin) for n=1:obj.classNum set(obj.hdlSet(n).C,varargin{:}) end
        end
    end % @author : slandarer % gzh : slandarer随笔 % Zhaoxu Liu (2022). Rectangular Tree 矩形树状图 % (https://www.mathworks.com/matlabcentral/fileexchange/118515-rectangular-tree), % MATLAB Central File Exchange. 检索来源 2022/10/3. end
完
MATLAB矩形树状图绘制能画成这样属实不易,如果有用请留个赞叭~
未经允许本代码请勿作商业用途,引用的话可以引用我file exchange上的链接,可使用如下格式:
Zhaoxu Liu (2022). Rectangular Tree 矩形树状图 (https://www.mathworks.com/matlabcentral/fileexchange/118515-rectangular-tree), MATLAB Central File Exchange. 检索来源 2022/10/3.
若转载请保留以上file exchange链接及本文链接!!!
全部m文件及数据获取: 链接:https://pan.baidu.com/s/1gGF1T4AD0WKNP487tnMq6A?pwd=slan 提取码:slan

