
APP的性能监控包括: CPU 占用率、 内存使用情况、网络状况监控、启动时闪退、卡顿、FPS、使用时崩溃、耗电量监控、流量监控等等。
文中所有代码都已同步到github中,有兴趣的可以clone下来一起探讨下。
CPU作为手机的中央处理器,可以说是手机最关键的组成部分,所有应用程序都需要它来调度运行,资源有限。所以当我们的APP因设计不当,使 CPU 持续以高负载运行,将会出现APP卡顿、手机发热发烫、电量消耗过快等等严重影响用户体验的现象。
因此我们对应用在CPU中占用率的监控,将变得尤为重要。那么我们应该如何来获取CPU的占有率呢?!
我们都知道,我们的APP在运行的时候,会对应一个Mach Task,而Task下可能有多条线程同时执行任务,每个线程都是作为利用CPU的基本单位。所以我们可以通过获取当前Mach Task下,所有线程占用 CPU 的情况,来计算APP的 CPU 占用率。
在《OS X and iOS Kernel Programming》是这样描述 Mach task 的:
任务(task)是一种容器(container)对象,虚拟内存空间和其他资源都是通过这个容器对象管理的,这些资源包括设备和其他句柄。严格地说,Mach 的任务并不是其他操作系统中所谓的进程,因为 Mach 作为一个微内核的操作系统,并没有提供“进程”的逻辑,而只是提供了最基本的实现。不过在 BSD 的模型中,这两个概念有1:1的简单映射,每一个 BSD 进程(也就是 OS X 进程)都在底层关联了一个 Mach 任务对象。
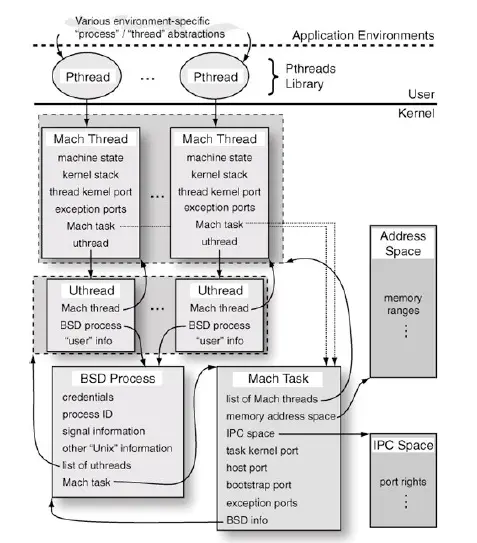
Mac OS X 中进程子系统组成的概念图
iOS 是基于 Apple Darwin 内核,由kernel、XNU和Runtime 组成,而XNU 是Darwin 的内核,它是“X is not UNIX”的缩写,是一个混合内核,由 Mach 微内核和 BSD 组成。Mach 内核是轻量级的平台,只能完成操作系统最基本的职责,比如:进程和线程、虚拟内存管理、任务调度、进程通信和消息传递机制等。其他的工作,例如文件操作和设备访问,都由 BSD 层实现。
iOS 的线程技术与Mac OS X类似,也是基于 Mach 线程技术实现的,在 Mach 层中thread_basic_info 结构体封装了单个线程的基本信息:
struct thread_basic_info {
    time_value_t  user_time;      /* user run time */
    time_value_t  system_time;    /* system run time */
    integer_t    cpu_usage;       /* scaled cpu usage percentage */
    policy_t     policy;          /* scheduling policy in effect */
    integer_t    run_state;       /* run state (see below) */
    integer_t    flags;           /* various flags (see below) */
    integer_t    suspend_count;   /* suspend count for thread */
    integer_t    sleep_time;      /* number of seconds that thread  has been sleeping */
}
一个Mach Task包含它的线程列表。内核提供了task_threads API 调用获取指定 task 的线程列表,然后可以通过thread_info API调用来查询指定线程的信息,在 thread_act.h 中有相关定义。
task_threads 将target_task 任务中的所有线程保存在act_list数组中,act_listCnt表示线程个数:
kern_return_t task_threads
(
    task_t target_task,
    thread_act_array_t *act_list,
    mach_msg_type_number_t *act_listCnt
);
thread_info结构如下:
kern_return_t thread_info
(
    thread_act_t target_act,
    thread_flavor_t flavor,  // 传入不同的宏定义获取不同的线程信息
    thread_info_t thread_info_out,  // 查询到的线程信息
    mach_msg_type_number_t *thread_info_outCnt  // 信息的大小
);
所以我们如下来获取CPU的占有率:
#import "LSLCpuUsage.h"
#import
#import
#import
#import
#import

@implementation LSLCpuUsage

+ (double)getCpuUsage {
    kern_return_t           kr;
    thread_array_t          threadList;         // 保存当前Mach task的线程列表
    mach_msg_type_number_t  threadCount;        // 保存当前Mach task的线程个数
    thread_info_data_t      threadInfo;         // 保存单个线程的信息列表
    mach_msg_type_number_t  threadInfoCount;    // 保存当前线程的信息列表大小
    thread_basic_info_t     threadBasicInfo;    // 线程的基本信息

    // 通过“task_threads”API调用获取指定 task 的线程列表
    //  mach_task_self_,表示获取当前的 Mach task
    kr = task_threads(mach_task_self(), &threadList, &threadCount);
    if (kr != KERN_SUCCESS) {
        return -1;
    }
    double cpuUsage = 0;
    for (int i = 0; i < threadCount; i++) {
        threadInfoCount = THREAD_INFO_MAX;
        // 通过“thread_info”API调用来查询指定线程的信息
        //  flavor参数传的是THREAD_BASIC_INFO,使用这个类型会返回线程的基本信息,
        //  定义在 thread_basic_info_t 结构体,包含了用户和系统的运行时间、运行状态和调度优先级等
        kr = thread_info(threadList[i], THREAD_BASIC_INFO, (thread_info_t)threadInfo, &threadInfoCount);
        if (kr != KERN_SUCCESS) {
            return -1;
        }

        threadBasicInfo = (thread_basic_info_t)threadInfo;
        if (!(threadBasicInfo->flags & TH_FLAGS_IDLE)) {
            cpuUsage += threadBasicInfo->cpu_usage;
        }
    }

    // 回收内存,防止内存泄漏
    vm_deallocate(mach_task_self(), (vm_offset_t)threadList, threadCount * sizeof(thread_t));

    return cpuUsage / (double)TH_USAGE_SCALE * 100.0;
}
@end
虽然现在的手机内存越来越大,但毕竟是有限的,如果因为我们的应用设计不当造成内存过高,可能面临被系统“干掉”的风险,这对用户来说是毁灭性的体验。
Mach task 的内存使用信息存放在mach_task_basic_info结构体中 ,其中resident_size 为应用使用的物理内存大小,virtual_size为虚拟内存大小,在task_info.h中:
#define MACH_TASK_BASIC_INFO     20         /* always 64-bit basic info */
struct mach_task_basic_info {
        mach_vm_size_t  virtual_size;       /* virtual memory size (bytes) */
        mach_vm_size_t  resident_size;      /* resident memory size (bytes) */
        mach_vm_size_t  resident_size_max;  /* maximum resident memory size (bytes) */
        time_value_t    user_time;          /* total user run time for
                                               terminated threads */
        time_value_t    system_time;        /* total system run time for
                                               terminated threads */
        policy_t        policy;             /* default policy for new threads */
        integer_t       suspend_count;      /* suspend count for task */
};
获取方式是通过task_infoAPI 根据指定的 flavor 类型,返回 target_task 的信息,在task.h中:
kern_return_t task_info
(
    task_name_t target_task,
    task_flavor_t flavor,
    task_info_t task_info_out,
    mach_msg_type_number_t *task_info_outCnt
);
笔者尝试过使用如下方式获取内存情况,基本和腾讯的GT的相近,但是和Xcode和Instruments的值有较大差距:
// 获取当前应用的内存占用情况,和Xcode数值相差较大
+ (double)getResidentMemory {
    struct mach_task_basic_info info;
    mach_msg_type_number_t count = MACH_TASK_BASIC_INFO_COUNT;
    if (task_info(mach_task_self(), MACH_TASK_BASIC_INFO, (task_info_t)&info, &count) == KERN_SUCCESS) {
        return info.resident_size / (1024 * 1024);
    } else {
        return -1.0;
    }
}
后来看了一篇博主讨论了这个问题,说使用phys_footprint才是正解,博客地址。亲测,基本和Xcode的数值相近。
// 获取当前应用的内存占用情况,和Xcode数值相近
+ (double)getMemoryUsage {
    task_vm_info_data_t vmInfo;
    mach_msg_type_number_t count = TASK_VM_INFO_COUNT;
    if(task_info(mach_task_self(), TASK_VM_INFO, (task_info_t) &vmInfo, &count) == KERN_SUCCESS) {
        return (double)vmInfo.phys_footprint / (1024 * 1024);
    } else {
        return -1.0;
    }
}
博主文中提到:关于 phys_footprint 的定义可以在 XNU 源码中,找到 osfmk/kern/task.c 里对于 phys_footprint 的注释,博主认为注释里提到的公式计算的应该才是应用实际使用的物理内存。
/*
 * phys_footprint
 *   Physical footprint: This is the sum of:
 *     + (internal - alternate_accounting)
 *     + (internal_compressed - alternate_accounting_compressed)
 *     + iokit_mapped
 *     + purgeable_nonvolatile
 *     + purgeable_nonvolatile_compressed
 *     + page_table
 *
 * internal
 *   The task's anonymous memory, which on iOS is always resident.
 *
 * internal_compressed
 *   Amount of this task's internal memory which is held by the compressor.
 *   Such memory is no longer actually resident for the task [i.e., resident in its pmap],
 *   and could be either decompressed back into memory, or paged out to storage, depending
 *   on our implementation.
 *
 * iokit_mapped
 *   IOKit mappings: The total size of all IOKit mappings in this task, regardless of
     clean/dirty or internal/external state].
 *
 * alternate_accounting
 *   The number of internal dirty pages which are part of IOKit mappings. By definition, these pages
 *   are counted in both internal *and* iokit_mapped, so we must subtract them from the total to avoid
 *   double counting.
 */
当然我也是赞同这点的>.= 1.0 else { return } lastTime = link.timestamp fps = Double(count) / delta let fpsText = "\(String.init(format: "%.3f", fps)) FPS" count = 0 let attrMStr = NSMutableAttributedString(attributedString: NSAttributedString(string: fpsText)) if fps > 55.0{ fpsColor = UIColor.green } else if(fps >= 50.0 && fps
最近更新
- 深拷贝和浅拷贝的区别(重点)
- 【Vue】走进Vue框架世界
- 【云服务器】项目部署—搭建网站—vue电商后台管理系统
- 【React介绍】 一文带你深入React
- 【React】React组件实例的三大属性之state,props,refs(你学废了吗)
- 【脚手架VueCLI】从零开始,创建一个VUE项目
- 【React】深入理解React组件生命周期----图文详解(含代码)
- 【React】DOM的Diffing算法是什么?以及DOM中key的作用----经典面试题
- 【React】1_使用React脚手架创建项目步骤--------详解(含项目结构说明)
- 【React】2_如何使用react脚手架写一个简单的页面?

