-
最牛逼android上的图表库MpChart二 折线图
- MpChart折线图介绍
- MpChart折线图实例
- MpChart效果
最近工作中,用到了mpchart图表库,现在分享受下mpchart图表库的各个图表在实际工作应用场景:
- 最牛逼android上的图表库MpChart(一) 介绍篇
- 最牛逼android上的图表库MpChart(二) 折线图
- 最牛逼android上的图表库MpChart(三) 条形图
- 最牛逼android上的图表库MpChart(四) 饼图
- 最牛逼android上的图表库MpChart(五) 泡泡图
使用mpchart jar包:mpandroidchartlibrary-2-1-6.jar 如果是在studio下,进行如下引用: repositories { maven { url “https://jitpack.io” } }
dependencies { compile ‘com.github.PhilJay:MPAndroidChart:v2.1.6’ }
MpChart折线图介绍- LineChart类
-
使用哪些API
- setBackgroundColor(int color): Sets the background color that will cover the whole chart-view. In addition, a background-color can be set via .xml in the layout file.
- setDescription(String desc): Set a description text that appears in the bottom right corner of the chart.
- setDescriptionColor(int color): Sets the color of the description text.
- setDescriptionPosition(float x, float y): Sets a custom position for the description text in pixels on the screen.
- setDescriptionTypeface(Typeface t): Sets the Typeface used for drawing the description text.
- setDescriptionTextSize(float size): Sets the size of the description text in pixels, min 6f, max 16f.
- setNoDataTextDescription(String desc): Sets the text that should appear if the chart is empty.
- setDrawGridBackground(boolean enabled): If enabled, the background rectangle behind the chart drawing-area will be drawn.
- setGridBackgroundColor(int color): Sets the color the grid-background should be drawn with.
- setDrawBorders(boolean enabled): Enables / disables drawing the chart borders (lines surrounding the chart).
- setBorderColor(int color): Sets the color of the chart border lines.
- setBorderWidth(float width): Sets the width of the chart border lines in dp.
- setMaxVisibleValueCount(int count): Sets the number of maximum visible drawn value-labels - on the chart. This only takes affect when setDrawValues() is enabled.
- 布局文件
- Java代码
<RelativeLayout xmlns:android="http://schemas.android.com/apk/res/android" xmlns:tools="http://schemas.android.com/tools" android:layout_width="match_parent" android:layout_height="match_parent" > <com.github.mikephil.charting.charts.LineChart android:id="@+id/chart1" android:layout_width="match_parent" android:layout_height="match_parent"/> RelativeLayout>
package com.example.mpchart; import java.util.ArrayList; import android.app.Activity; import android.graphics.Color; import android.graphics.Typeface; import android.os.Bundle; import android.os.Handler; import android.os.Looper; import android.os.Message; import android.view.WindowManager; import com.example.mpchart.data.IDataSource; import com.example.mpchart.data.IDataSource.onDataChangedListener; import com.example.mpchart.data.SucRateDataSource; import com.example.mpchart.utils.DBHelper; import com.example.mpchart.utils.DateUtils; import com.example.mpchart.utils.LogUtils; import com.github.mikephil.charting.charts.LineChart; import com.github.mikephil.charting.components.Legend; import com.github.mikephil.charting.components.Legend.LegendDirection; import com.github.mikephil.charting.components.Legend.LegendForm; import com.github.mikephil.charting.components.LimitLine; import com.github.mikephil.charting.components.LimitLine.LimitLabelPosition; import com.github.mikephil.charting.components.XAxis; import com.github.mikephil.charting.components.XAxis.XAxisPosition; import com.github.mikephil.charting.components.YAxis; import com.github.mikephil.charting.components.YAxis.YAxisLabelPosition; import com.github.mikephil.charting.data.Entry; import com.github.mikephil.charting.data.LineData; import com.github.mikephil.charting.data.LineDataSet; public class MainActivity extends Activity {
private static final String TAG = "MainActivity"; private LineChart mChart; private IDataSource mDataSource = new SucRateDataSource(); private Handler mHandler = new Handler(Looper.getMainLooper()) {
@Override
public void handleMessage(Message msg) {
super.handleMessage(msg); getData(); }
}; @Override
protected void onCreate(Bundle savedInstanceState) {
super.onCreate(savedInstanceState); getWindow().setFlags(WindowManager.LayoutParams.FLAG_FULLSCREEN,
WindowManager.LayoutParams.FLAG_FULLSCREEN); setContentView(R.layout.activity_main); mChart = (LineChart) findViewById(R.id.chart1); // //在chart上的右下角加描述
mChart.setDescription(mDataSource.getDescription()); mChart.setDescriptionTextSize(30); // //设置Y轴上的单位
// mChart.setUnit("%"); //设置透明度
// mChart.setAlpha(0.8f); //设置网格底下的那条线的颜色
// mChart.setBorderColor(Color.rgb(213, 216, 214)); // mChart.setBorderColor(Color.rgb(0, 0, 0)); // mChart.setBackgroundColor(Color.rgb(255, 255, 255)); mChart.setGridBackgroundColor(Color.rgb(255, 255, 255)); //设置Y轴前后倒置
// mChart.setInvertYAxisEnabled(false); // //设置高亮显示
// mChart.setHighlightEnabled(true); //设置是否可以触摸,如为false,则不能拖动,缩放等
mChart.setTouchEnabled(true); //设置是否可以拖拽,缩放
mChart.setDragEnabled(true); mChart.setScaleEnabled(true); //设置是否能扩大扩小
mChart.setPinchZoom(true); // 设置背景颜色
// mChart.setBackgroundColor(Color.GRAY); //设置点击chart图对应的数据弹出标注
MyMarkerView mv = new MyMarkerView(this, R.layout.custom_marker_view); // define an offset to change the original position of the marker
// (optional)
// mv.setOffsets(-mv.getMeasuredWidth() / 2, -mv.getMeasuredHeight()); // mv.setMinimumHeight(80); // // set the marker to the chart
// mChart.setMarkerView(mv); // // enable/disable highlight indicators (the lines that indicate the
// // highlighted Entry)
// mChart.setHighlightIndicatorEnabled(false); //设置字体格式,如正楷
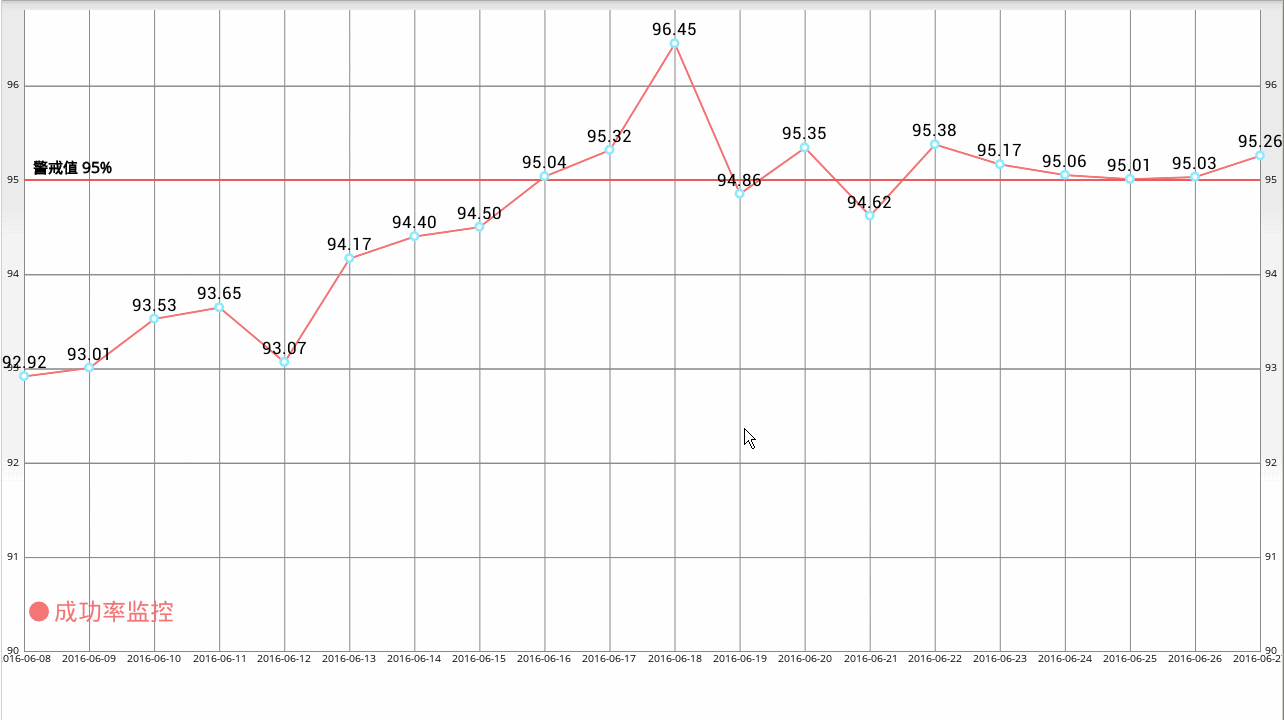
Typeface tf = Typeface.createFromAsset(getAssets(), "OpenSans-Regular.ttf"); mChart.setDescriptionTypeface(tf); LimitLine ll1 = new LimitLine(95f, "警戒值 95%"); ll1.setLineWidth(2f); // ll1.setLineColor(Color.rgb(0,0,0)); // ll1.enableDashedLine(10f, 10f, 0f); ll1.setLabelPosition(LimitLabelPosition.LEFT_TOP); ll1.setTextSize(15f); ll1.setTypeface(tf); XAxis xl = mChart.getXAxis(); // xl.setAvoidFirstLastClipping(true); // xl.setAdjustXLabels(true); xl.setPosition(XAxisPosition.BOTTOM); // 设置X轴的数据在底部显示 xl.setTypeface(tf); // 设置字体 xl.setTextSize(10f); // 设置字体大小 xl.setSpaceBetweenLabels(0); // 设置数据之间的间距' YAxis yl = mChart.getAxisLeft(); yl.setPosition(YAxisLabelPosition.OUTSIDE_CHART); // yl.setAxisMaxValue(220f); yl.addLimitLine(ll1); yl.setTypeface(tf); // 设置字体 yl.setTextSize(10f); // s设置字体大小 yl.setTypeface(tf); yl.setAxisMinValue(90f); yl.setStartAtZero(false); // yl.setLabelCount(5); // 设置Y轴最多显示的数据个数 YAxis y2 = mChart.getAxisRight(); y2.setPosition(YAxisLabelPosition.OUTSIDE_CHART); y2.setTypeface(tf); // 设置字体 y2.setTextSize(10f); // s设置字体大小 y2.setTypeface(tf); y2.setAxisMinValue(90f); y2.setStartAtZero(false); getData(); new Thread(mRunnable).start(); }
private Runnable mRunnable = new Runnable() {
@Override
public void run() {
while(true) {
try {
Thread.sleep(15*1000);//每隔15s刷新一次,可以看到动态图 mHandler.sendMessage(mHandler.obtainMessage()); } catch (InterruptedException e) {
e.printStackTrace(); }
}
}
}; private onDataChangedListener listener = new onDataChangedListener() {
@Override
public void onChanged(String[] xx, String[] yy) {
notifyDataChanged(xx, yy); }
}; private void getData() {
LogUtils.d(TAG, "getData() " + DateUtils.getCurrentDate()); new Thread(new Runnable() {
@Override
public void run() {
DBHelper.getInstance().init(); String sql = "select *from suc_rate_chart_0614"; final String[] xx = DBHelper.getInstance().query(sql,2); final String[] yy = DBHelper.getInstance().query(sql,3); mHandler.post(new Runnable() {
@Override
public void run() {
listener.onChanged(xx, yy); }
}); }
}).start(); }
private void notifyDataChanged(String[] xx, String[] yy) {
Typeface tf = Typeface.createFromAsset(getAssets(),"OpenSans-Regular.ttf"); // 加载数据
setData(xx,yy ); //从X轴进入的动画
mChart.animateX(2000); // mChart.animateY(2000); //从Y轴进入的动画 // mChart.animateXY(2000, 2000); //从XY轴一起进入的动画 //设置最小的缩放
mChart.setScaleMinima(0.5f, 1f); //设置视口
// mChart.centerViewPort(10, 50); // get the legend (only possible after setting data)
Legend l = mChart.getLegend(); l.setForm(LegendForm.CIRCLE); //设置图最下面显示的类型 l.setTypeface(tf); l.setTextSize(30); l.setTextColor(Color.rgb(244, 117, 117)); l.setDirection(LegendDirection.LEFT_TO_RIGHT); l.setYOffset(100); l.setFormSize(20f); // set the size of the legend forms/shapes // 刷新图表
mChart.invalidate(); }
private void setData(String[] xx, String[] yy) {
ArrayListxVals = new ArrayList(); for (int i = 0; i < xx.length; i++) { xVals.add(xx[i]); }
ArrayListyVals = new ArrayList(); for (int i = 0; i < yy.length; i++) { yVals.add(new Entry(Float.parseFloat(yy[i]), i)); LogUtils.d(TAG, "yVals() " + Float.parseFloat(yy[i])); }
// create a dataset and give it a type
LineDataSet set1 = new LineDataSet(yVals, "成功率监控"); set1.setDrawCubic(false); //设置曲线为圆滑的线 set1.setCubicIntensity(0.2f); set1.setDrawFilled(false); //设置包括的范围区域填充颜色 set1.setDrawCircles(true); //设置有圆点 set1.setLineWidth(2f); //设置线的宽度 set1.setCircleSize(5f); //设置小圆的大小 set1.setHighLightColor(Color.rgb(244, 117, 117)); set1.setColor(Color.rgb(244, 117, 117)); //设置曲线的颜色 // create a data object with the datasets
LineData data = new LineData(xVals, set1); // set data
mChart.setData(data); }
}
MpChart效果